A clear process map turns messy steps into a visual everyone understands. This guide gives practical, step-by-step methods to map workflows, expose inefficiencies, and turn insights into faster, more reliable work.
November 22, 2025 (8mo ago) — last updated January 28, 2026 (5mo ago)
How to Create a Process Map: Step-by-Step Guide
Step-by-step process mapping guide to reveal inefficiencies, standardize work, and find automation opportunities—tools, tips, and next steps.
← Back to blog
How to Create a Process Map: Step-by-Step Guide
Learn how to create a process map to boost efficiency and clarity. This guide offers actionable steps to visualize workflows and drive real improvements.
Introduction
A good process map is more than a collection of boxes and arrows. It turns a complex, often unspoken series of actions into a clear, shared visual that anyone on your team can understand in seconds. This guide walks you through practical steps—scoping, gathering reality-based details, choosing a visual format, and turning the map into measurable improvements.
Beyond Boxes and Lines: Understanding Process Maps

Let’s reframe how we think about process mapping. It isn’t just a diagramming exercise; it’s building a common language for your team. A process map tells the story of how work actually gets done, exposing hidden friction points and bottlenecks.
When you put a workflow down on a screen, you make the invisible visible. Suddenly everyone can see where communication breaks down, where tasks are duplicated, and where a few changes could save hours of work.
The strategic value of seeing your workflow
Process mapping shifts your team from guessing to knowing. It gives you a factual foundation for meaningful improvements instead of decisions based on gut feelings.
Think about what this clarity delivers:
- Pinpoint inefficiencies: spot costly errors, delays, and duplicated efforts.
- Standardize best practices: document the most effective ways to complete tasks so everyone follows the same steps.
- Improve team communication: create a single source of truth so stakeholders share the same understanding.
A great process map is a catalyst for conversation. It sparks the “Wait, why do we do it this way?” questions that lead to real breakthroughs.
This practice has roots in early industrial engineering. The flow process chart was introduced by Frank B. Gilbreth in the early 20th century, formalizing how to document work visually1.
Ultimately, mapping a process is the essential first step toward improving it. Once you can see the workflow, you can identify where automation or redesign will have the biggest impact. Learn more about workflow automation in our guide on what is workflow automation.
Setting the Stage for an Effective Process Map
A great process map doesn’t just happen. You can’t simply open a tool and start drawing boxes and arrows. If you jump in without a plan, you’ll likely end up with a map that’s confusing or ignored. The real work starts before you draw a single line.
Think of it like building a house. You need a blueprint. This initial stage is about creating that blueprint—setting clear boundaries and understanding exactly what you want to accomplish.
Define your scope and set a clear goal
First, define where your process begins and ends. Vague boundaries create sprawling, useless maps. Keep it focused. Instead of mapping “customer support” broadly, try “from ticket received to ticket resolved.”
Once you have boundaries, ask: “Why are we mapping this?” That answer is your goal, and it should be specific and measurable. A clear goal gives your map purpose and a way to measure success. Are you trying to cut errors, speed up response times, or make onboarding simpler?
Examples of measurable goals:
- Reduce average time to resolve a customer support ticket by 20% in three months.
- Lower the error rate in monthly invoicing from 5% to under 1%.
- Shorten new-employee onboarding from three weeks to one.
Your goal is the North Star for the project. Every decision, box, and arrow should move you closer to that outcome.
Assemble your team and identify stakeholders
You can’t map a process accurately from an ivory tower. The real experts are the people doing the work. They know the shortcuts, pain points, and unofficial workarounds.
Identify all stakeholders—anyone who touches the process—and form a small project team (three to five people) for the heavy lifting. A good mix is:
- Someone who performs the process daily.
- A manager or team lead who sees the bigger picture.
- A representative from a dependent department.
Involving the right people early gets accurate information and builds the buy-in needed to implement improvements.
Gathering Your Raw Materials and Defining the Steps

You’ve set goals and assembled the right crew. Now it’s time to capture the raw reality of how things work right now. Forget improvements for the moment; document the process as it exists, warts and all.
You can’t just ask people what they do—people often describe the ideal version and omit workarounds. Use a mix of observation and collaboration to uncover the true steps.
How to actually get the information
To build an accurate “as-is” map, combine these methods:
- Direct observation: sit with team members doing the work and take notes. This reveals unofficial steps and real bottlenecks.
- Collaborative workshops: map the process together with sticky notes on a whiteboard to spark discussion and resolve disagreements on the spot.
- Individual interviews: one-on-one conversations uncover candid frustrations and exceptions.
The gold is in the exceptions. Ask, “What happens when things go wrong here?” or “What’s the most frustrating part of this for you?”
Breaking down the workflow into its core parts
As information flows in, break it into building blocks. Don’t draw the final map yet—capture every detail.
For each step, answer these questions:
- The action: What is the specific task? (e.g., “Approve expense report.”)
- The actor: Who is responsible? Role matters for handoffs.
- The inputs: What starts this step? (e.g., a completed form.)
- The outputs: What does this step produce for the next one?
- The decisions: Are there “if this, then that” splits? Note thresholds like “Is the invoice over $500?”
- The tools: What software or documents are used?
This creates a data-rich inventory that makes the final map reflect reality, not just a pretty diagram.
Choose Your Visual Language and Tools
Now turn that information into something visual and actionable. The way you draw your map determines how well your team understands it and uses it.
Choose the map that matches your mission—a napkin sketch for brainstorming, a formal diagram for handoffs and documentation.
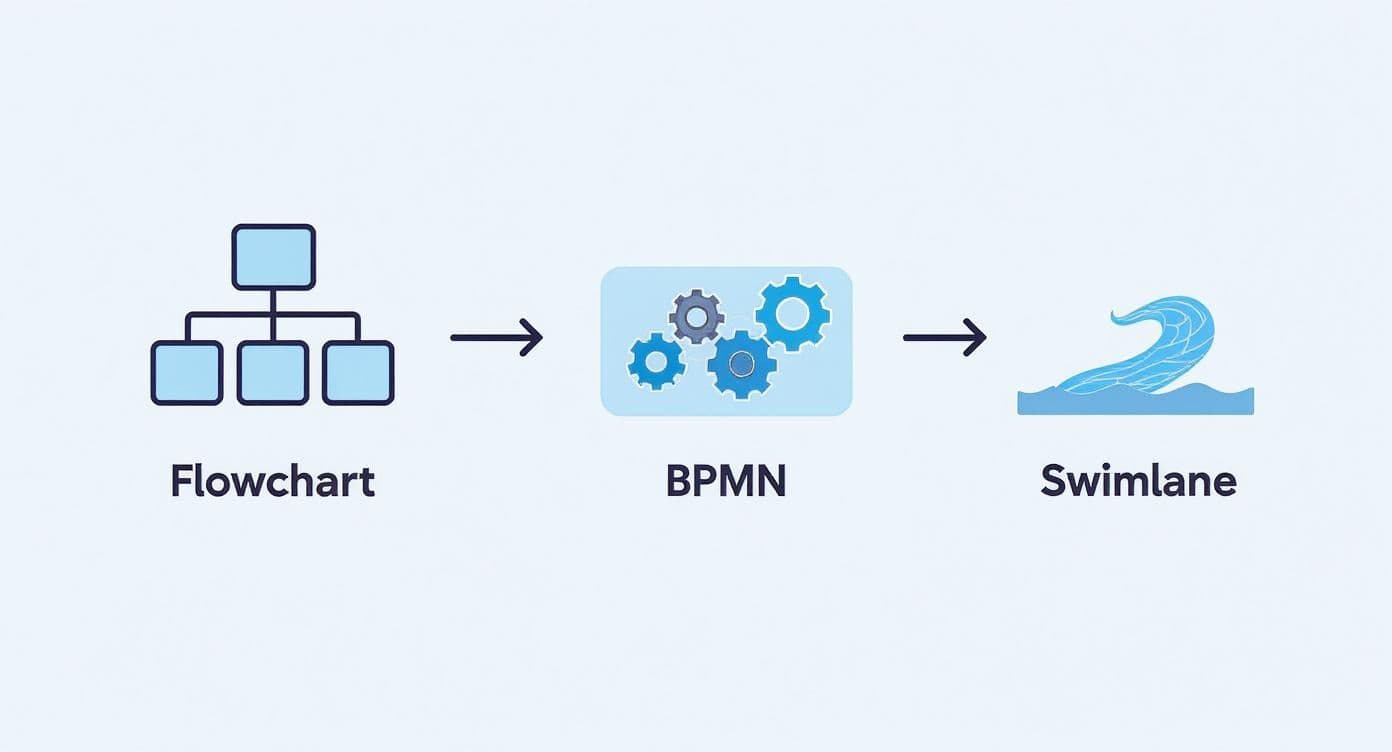
Picking your visual style: Flowchart, swimlane, or BPMN?
Common mapping “languages” each have strengths. Pick the one that fits your needs.
| Map Type | Best For | Key Feature |
|---|---|---|
| Simple flowchart | Straightforward, linear processes with few decision points. | Basic shapes (ovals, rectangles, diamonds) everyone recognizes. |
| Swimlane diagram | Processes that cross teams or departments. | Tasks are organized into “lanes” by actor, clarifying handoffs. |
| BPMN | Complex processes that need precision and automation. | Standardized symbols for events, gateways, and data flows.3 |
Choose the simplest format that tells the whole story. A clear flowchart beats a technically perfect but confusing BPMN diagram that no one can follow.
Selecting the right software for the job
Tool choice depends on budget, skill level, and how you collaborate.
- Digital whiteboards (Miro, FigJam): great for live brainstorming and collaborative sessions.
- Dedicated diagramming tools (Lucidchart, Gliffy, draw.io): ideal for polished, standardized diagrams with templates and symbol libraries.
- BPM software: for enterprise-level documentation and automation, use a full BPM suite—powerful but often more complex and costly.
Balance power with usability. Choose a tool that empowers your team, not one that becomes an extra hurdle.
Drawing the Map and Visualizing the Flow
Now build your visual story. The goal is a map so clear a new hire could understand the process without hand-holding.
Use standard shapes: rectangles for steps, diamonds for decisions, ovals for start and end. Connect with directional arrows and avoid crossing lines to keep the map readable.
Creating a clear and logical flow
Example: resolving a customer support ticket. A ticket is submitted, an agent reviews it, and then there’s a decision point—do they need more information? That skeleton becomes the backbone of your map.
Flesh it out with who does each step, what inputs and outputs exist, and which tools are used. Keep complexity manageable by layering detail: start high-level, then create drill-down maps for exceptions and edge cases.
The critical role of feedback and iteration
A first draft is only the start. Take it back to the people you interviewed, walk them through it, and ask, “Does this look right to you? Is this how it really works?”
A process map is a living document. Use feedback to spot missing steps, incorrect assumptions, or exceptions. Each revision makes the map more accurate and more valuable.
If you need examples, our library of sample workflow diagrams shows different ways to visualize processes effectively.
Turning Your Process Map into Actionable Improvements
A process map is a diagnostic tool that shows where opportunities and bottlenecks are located. With an accurate “as-is” map, you can move from anecdotes to facts.
From diagnosis to redesign
Walk through the map step-by-step. Ask where things stall, which steps are redundant, and where tasks bounce between people causing delays. Those pain points are the starting blocks for redesign.
Sketch the “to-be” process: what would this look like if you built it from scratch, knowing what you know now? Don’t accept “we’ve always done it this way.” Challenging assumptions uncovers gains—teams that map and optimize workflows often cut cycle times significantly2.
Value stream maps and cycle-time data can make waste obvious and prioritize improvements.
Making the new process a reality
Designing a better process is one thing; getting people to follow it is another. Translate each map step into clear, assignable tasks.
- Create actionable checklists for major steps.
- Assign clear ownership for every task or decision.
- Identify automation opportunities for repetitive manual work.
Turn map steps into daily habits by embedding them in your project tools. With Fluidwave you can convert map steps into assigned tasks, delegate work, and build automations to free your team’s time. Learn more in our guide to business process improvement strategies.
Common Questions About Process Mapping
How detailed should my process map be?
It depends on your goal. For onboarding a new teammate, a simple flowchart with 5–10 key steps is often enough. For automation or compliance, capture every decision and exception. Start simpler than you think—you can add detail later. A cluttered map is more confusing than a broad one.
What about team buy-in?
Frame mapping as a solution to a real pain point. Don’t lead with “We need to document our processes.” Instead, say, “Remember that frustrating handoff between sales and ops? Let’s map it so we can fix it.”
Other common hurdles:
- “But our process is always changing.” It should. Treat the map as a living document and review it quarterly or after major changes.
- “Who owns this map?” One person can lead the draft, but the team that runs the process should own the map to keep it accurate.
Ready to turn that map into a real, automated workflow? With Fluidwave, you can convert each step into an assigned task, delegate work to expert assistants, and build automations that free up your team’s time. Start streamlining your work for free today.
Quick Q&A
Q: What’s the first step to creating a process map? A: Define the scope and a measurable goal—know where the process starts and ends and what you want to improve.
Q: Who should be involved in mapping a process? A: Include people who do the work daily, a manager who sees the bigger picture, and representatives from dependent teams for accurate handoffs.
Q: How do I choose the right map type? A: Use the simplest format that tells the whole story: flowcharts for linear processes, swimlanes for cross-team flows, and BPMN for detailed automation needs.3
Bottom-line Q&A — Concise Answers to Common Pain Points
Q: How do I avoid an unusable, overcomplicated map?
A: Start with a clear scope and a high-level map. Add drill-down maps for complexity and keep each diagram focused on a specific goal.
Q: What’s the quickest way to validate a map’s accuracy?
A: Walk through the draft with the people who do the work and observe at least one live instance of the process.
Q: When should I pursue automation?
A: Prioritize repetitive, rule-based tasks with high volume or long cycle times. Use the map to quantify time spent and the potential ROI.
1.
Frank B. Gilbreth and the development of process charts are documented in historical summaries; see https://en.wikipedia.org/wiki/Frank_B._Gilbreth.
2.
Industry benchmarking shows that structured process mapping and improvement efforts can deliver substantial cycle-time reductions; see https://www.apqc.org/.
3.
BPMN is the widely used standard for detailed process modeling; see https://www.bpmn.org/.
Focus on What Matters.
Experience lightning-fast task management with AI-powered workflows. Our automation helps busy professionals save 4+ hours weekly.