Learn what time to completion really measures, why it gets misjudged, and practical ways to track and shorten it across individual and team work.
September 30, 2026 (1d ago)
Time to Completion: What It Means and How to Shorten It
Learn what time to completion really measures, why it gets misjudged, and practical ways to track and shorten it across individual and team work.
← Back to blog
People often underestimate how long work will take by a factor of roughly 1.7x, with one longitudinal study finding that actual hours averaged 1.7 times expected hours. Time to completion is worth tracking because the gap between an estimate and the elapsed reality affects staffing, delivery promises, and every downstream handoff.
A useful manager's habit is to stop treating completion time as a promise attached to one task. It's better understood as a distribution of possible durations. Your job isn't to guess a perfect number. It's to define the work clearly, collect comparable observations, and reduce the causes of both ordinary delay and extreme delay.
What Time to Completion Actually Measures
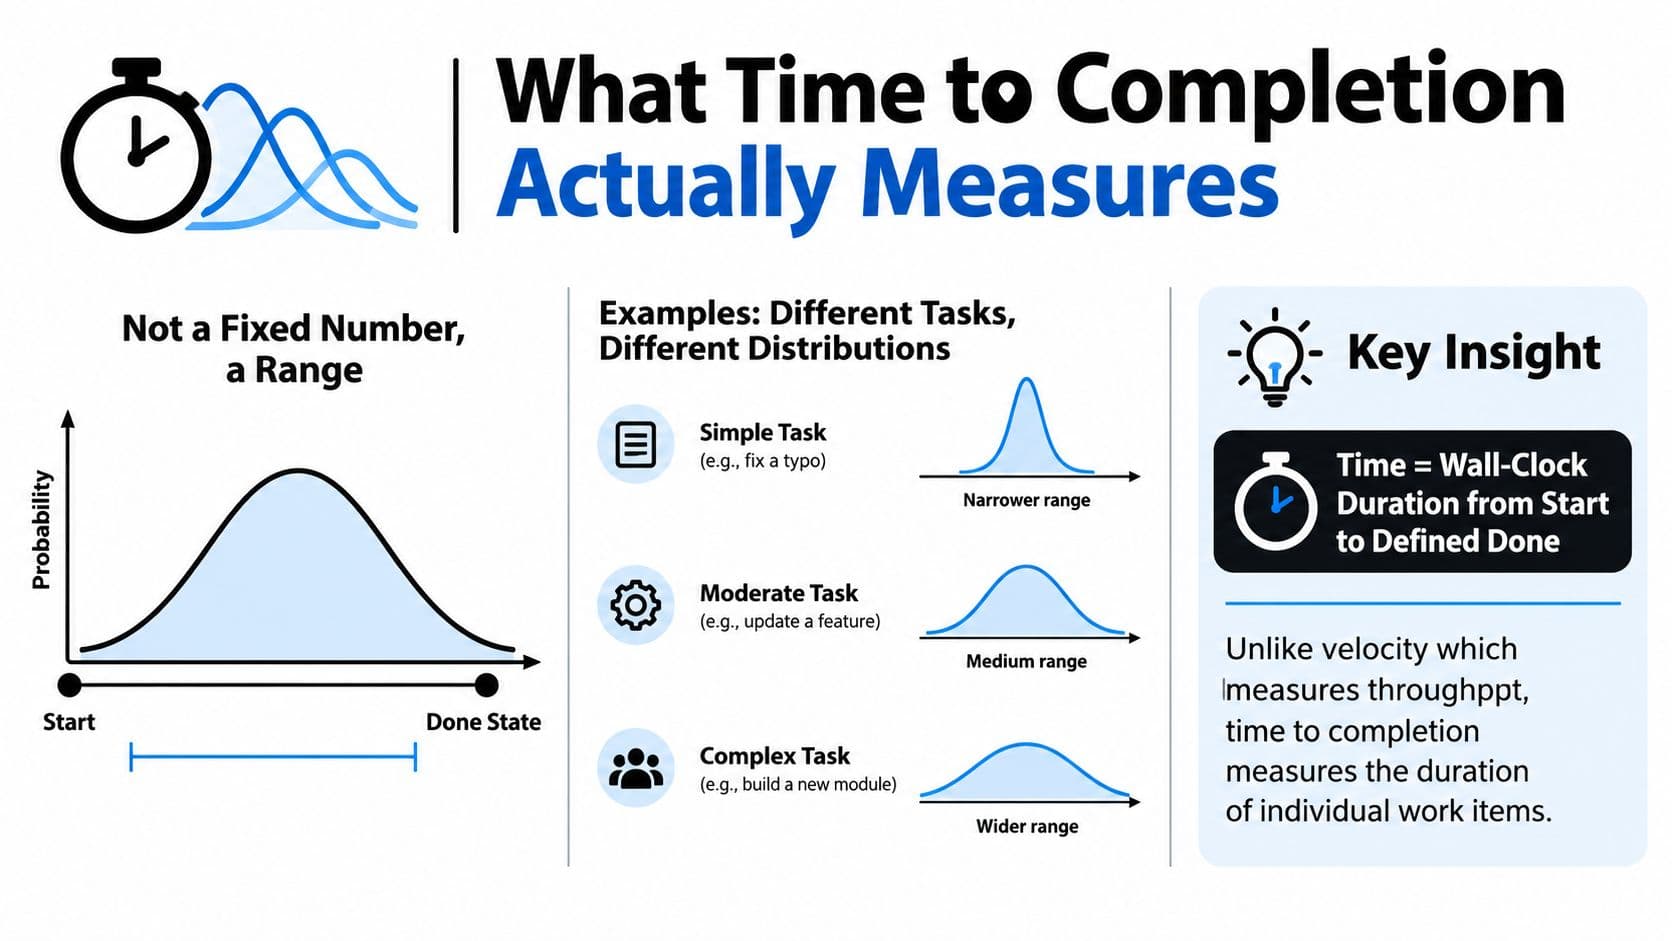
Time to completion is the elapsed wall-clock duration between a defined start event and a defined done state. If a ticket is accepted on Monday morning and deployed on Wednesday afternoon, the metric includes the waiting, interruptions, reviews, and handoffs between those events.
That makes it different from a single estimate. A task may sometimes finish quickly, often finish around a middle value, and occasionally remain open far longer because it encounters missing information or a blocked approval. The practical model is a distribution, not a fixed point.
Three related measures
Managers commonly mix up three durations:
- Cycle time measures the duration of one uninterrupted work block. It might describe the time someone actively spends drafting a report.
- Time to completion measures the full elapsed duration from the chosen start trigger to the defined done state.
- Lead time measures the full request-to-delivery window, including the queue before work begins.
Suppose a designer spends three hours actively editing a landing page. The cycle time may be three hours, while time to completion is longer because the task sat in a queue, waited for copy, and went through review. Lead time may be longer still if the request waited before acceptance.
The planning-fallacy evidence explains why this distinction matters. A 1994 study found that people predicted completion in 33.9 days on average but took 55.5 days, a substantial gap between expected and elapsed duration (the original study PDF). An estimate usually describes the story people tell themselves about the work. Time to completion records what happened across the whole system.
Make the boundaries repeatable
Choose one start trigger, such as ticket accepted, task opened, or brief approved. Choose one end trigger, such as submitted, approved, or deployed. Write those definitions into the team's operating notes.
Don't compare a writer's “draft started” to another writer's “brief received.” Those are different measurements. If the work involves hiring or staffing, a resource such as Spark's benchmark cost per hire Italia can add useful context, but it shouldn't replace your own operational definitions and logs.
Practical rule: If two people can reasonably disagree about whether a task has started or finished, the metric isn't ready for management use.
How to Calculate Time to Completion Step by Step
A new team lead doesn't need a complex analytics system to begin. A central spreadsheet or workflow log is enough if every entry uses the same timestamps and status definitions.
Start with one work item
The single-task formula is:
Time to completion = end timestamp − start timestamp
Use hours when the work normally finishes within a day. Use days when queue time and overnight pauses matter. For an illustrative report-writing task, record a start time of 9:00 and an end time of 15:00. The elapsed time is 6 hours. If the writer stopped for lunch or another meeting, don't convert wall-clock duration into active effort without accounting for the break. Record active effort separately if that distinction matters.
Add steps and waiting time
For a multi-step project, use:
Total duration = sum of step durations + handoff wait time
An illustrative onboarding flow might contain five steps whose combined working and waiting time totals 11.3 days. The important detail is not the decimal. It's the explicit inclusion of time between steps. If human resources finishes one step on Monday and the hiring manager reviews it on Thursday, that interval belongs in the end-to-end measure.
Historical scheduling analysis found that adding median step times underestimated true end-to-end duration by an average of 67 hours, rising to 81 hours for projects with three or more steps. It also found that 67% of projects finished later than the median-based estimate, with multi-step projects averaging 155 hours in actual completion time versus about 91 hours in the summed median estimate (historical project-scheduling analysis).
Weight team performance by actual mix
A team metric should reflect the work the team really handles, not an unweighted average of unlike tasks. Use:
Weighted average = sum of each task type's average duration × its share of total volume
For an illustrative support queue of 120 tickets per week, separate password requests, billing questions, technical investigations, and escalations. If routine requests make up most of the queue, they should carry more weight than rare investigations. Otherwise, a small number of complex cases can make the reported average look worse than the experience of most customers.
| Formula | When to Use | Worked Example |
|---|---|---|
| End timestamp − start timestamp | One comparable task | A report starts at 9:00 and reaches done at 15:00, for 6 hours |
| Sum of step durations + handoff waits | A sequential project | Five onboarding steps total 11.3 days, including review waits |
| Sum of task-type averages × volume share | A mixed team queue | A support team processes 120 tickets per week, weighted by ticket category |
Instrument every entry into one central log. A useful schema includes task type, owner, start trigger, end trigger, start timestamp, end timestamp, interruption count, handoff timestamps, and reason for delay. For further guidance on estimating project schedules, see this practical timeline estimation framework.
Real Benchmarks for Individual and Team Work
Benchmarks help a manager avoid two opposite mistakes. The first is assuming a task should be fast because it looks familiar. The second is treating an external benchmark as a promise that applies unchanged to the team's own process.
A large 2021 survey of more than 300 UX researchers found a median and average completion time of 42 days for a recent research project. The spread by project type was substantial: discovery projects had a 60-day median, iterative projects had a 35-day median, and evaluative or post-release feedback projects had a 28-day median (UX research timeline benchmark). The same survey found that 59.3% of respondents described projects as taking weeks, while 30.3% described them as taking months.
That result isn't a universal benchmark for every product team. It demonstrates something more useful: the purpose and complexity of the work change the distribution. A discovery project needs recruiting, exploration, synthesis, and alignment. An evaluative project may begin with a narrower question and a more established method.
Use benchmarks as starting anchors
For other work types, teams often maintain local ranges for bug fixes, content production, and onboarding workflows. Those ranges are only useful when the definitions match. A bug-fix measure that starts when an engineer accepts a ticket can't be compared with one that starts when a customer first reports the issue.
| Work Type | Typical Range | Notes |
|---|---|---|
| UX research project | 42-day median in the cited survey | Project purpose changes the median substantially |
| Software bug fix | Use your team's recorded distribution | Separate routine fixes from investigations |
| Content production | Use your team's recorded distribution | Define whether review and approval are included |
| Onboarding workflow | Use your team's recorded distribution | Include queue time between functions |
| Post-release feedback project | 28-day median in the cited UX survey | The benchmark reflects one research context, not every workflow |
Look beyond the middle
The median tells you what happens to the middle work item. It doesn't tell you how much capacity the slowest work consumes. A project can have a reasonable median while a small group of blocked items stays open long enough to distort planning and create urgent escalations.
Track at least the median and a high-percentile value for each well-defined task type. Review the slow items individually. Ask whether they were more complex, or whether they encountered a preventable queue, unclear ownership, missing input, or unnecessary approval.
Sector differences matter sharply. A regulated financial workflow, a customer support queue, and a creative production process may all use the word “complete” while carrying very different controls and dependencies. Use published research to form a question, then use your own history to set expectations.
Why Most Completion Estimates Miss
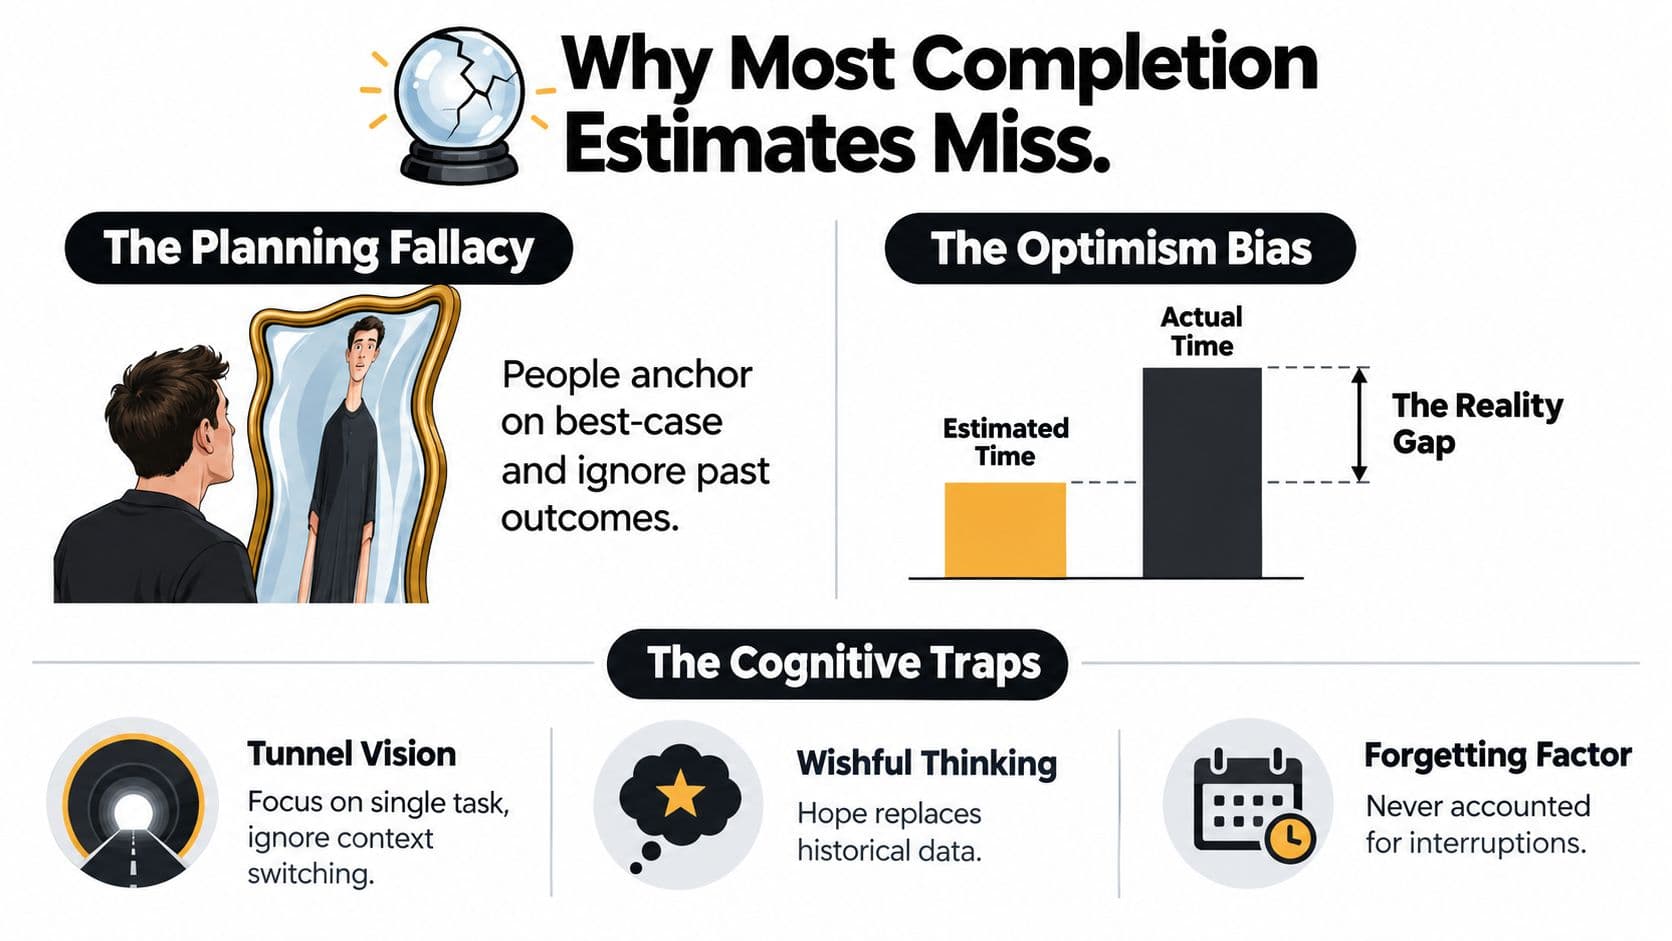
Most estimates fail before the work begins. People picture the task itself, not the interruptions, decisions, reviews, and competing priorities that surround it. That's the planning fallacy in operational form: the estimate follows the best-case narrative while the actual duration follows a wider distribution.
The 1994 study cited earlier illustrates the scale of that gap, with 33.9 days predicted against 55.5 days actual. Another longitudinal study found that participants completed only 53% of weekly tasks in the originally planned week, while actual hours averaged 1.7 times expected hours (longitudinal evidence on planning and completion).
Why pressure doesn't solve the problem
A shorter deadline sounds like a simple way to force faster execution. The evidence is less reassuring. In one field experiment, completion was 57.1% in one comparison versus 45.6% without the deadline, but the difference wasn't statistically significant. A separate finding reported that 77.6% of timed tasks were completed later than intended, even though the median delay was only 1 hour (field experiment on deadlines and completion).
That distinction matters. A one-hour slip on a small task isn't the same operational problem as a project that expands across weeks. Deadline pressure may change attention, but it doesn't remove dependencies or clarify ambiguous scope.
Diagnose the estimate, not the person
Ask three questions:
- What was assumed? Was the estimate based on uninterrupted work, complete inputs, and immediate review?
- What changed? Did the scope, owner, priority, or acceptance criteria move after the estimate?
- What does history say? Do comparable tasks regularly exceed the estimate for the same reason?
If your last ten task estimates missed by less than 20%, either your team is unusual or your tracking is incomplete. That isn't an accusation. It's a prompt to check whether people are estimating elapsed time, active effort, or an idealized version of the task.
A practical guide such as this gentle task completion guide can help individual contributors make the work more concrete. Managers still need to compare predictions with recorded outcomes, because motivation and confidence aren't substitutes for base rates.
Hidden Costs That Slow Every Task Down
A task rarely loses time through one dramatic failure. It loses time through small frictions that appear repeatedly: a notification that breaks concentration, a missing decision, a confirmation screen, or a handoff that waits in someone else's queue.
Cognitive load has a measurable effect even when the underlying motor task stays the same. In a military medicine study, adding cognitive load delayed completion by about 1.16 to 1.47 seconds across task types, with the authors concluding that cognitive load significantly increased both initiation and completion time (military medicine study of cognitive load).
A mixed-reality study found that task completion time was 49% longer under high-load conditions, with mean completion time rising from 43.83 seconds in the control group to 50.13 seconds in the high-load group (mixed-reality study of interface load). The exact environment differs from office work, but the operating lesson transfers: irrelevant signals and decision burden make work take longer.
| Friction Source | Typical Added Seconds | Meaning It Lost | Design Lever |
|---|---|---|---|
| Context switching | Varies by task and person | Attention must be rebuilt before work resumes | Batch similar work and protect focus blocks |
| Interface clutter | Measurable delays under high-load conditions | The worker scans and decides before acting | Remove irrelevant prompts and signals |
| Repeated approvals | Accumulates across handoffs | People wait for decisions that could be grouped | Consolidate related approvals |
| Notification load | Varies with channel and urgency | The task competes with incoming requests | Route alerts by priority |
| Missing information | Can extend the tail substantially | Work pauses while someone supplies context | Add required fields at intake |
| Ownership ambiguity | Creates dormant queue time | No person knows who should act next | Assign one accountable owner |
Why the tail grows first
These frictions don't affect every task equally. A focused worker with complete information may barely notice them. A task that changes hands, requires judgment, or sits beside several priorities can collect many small delays.
That's why averages can look acceptable while individual items drag. The median may remain stable as a minority of tasks accumulate interruptions and waits. Review the slowest completed items, not just the average, and classify the reason for each delay. A workflow redesign should target repeatable causes, such as batching requests, removing non-essential confirmation screens, or placing required information at the start.
For a practical discussion of reducing unnecessary workflow effort, see how to reduce friction.
Shortening Time to Completion With Automation and Delegation
A task's time to completion is rarely a single number. It behaves more like a distribution, with a typical middle and a long upper tail. Automation and delegation shorten both, but they do it in different ways.
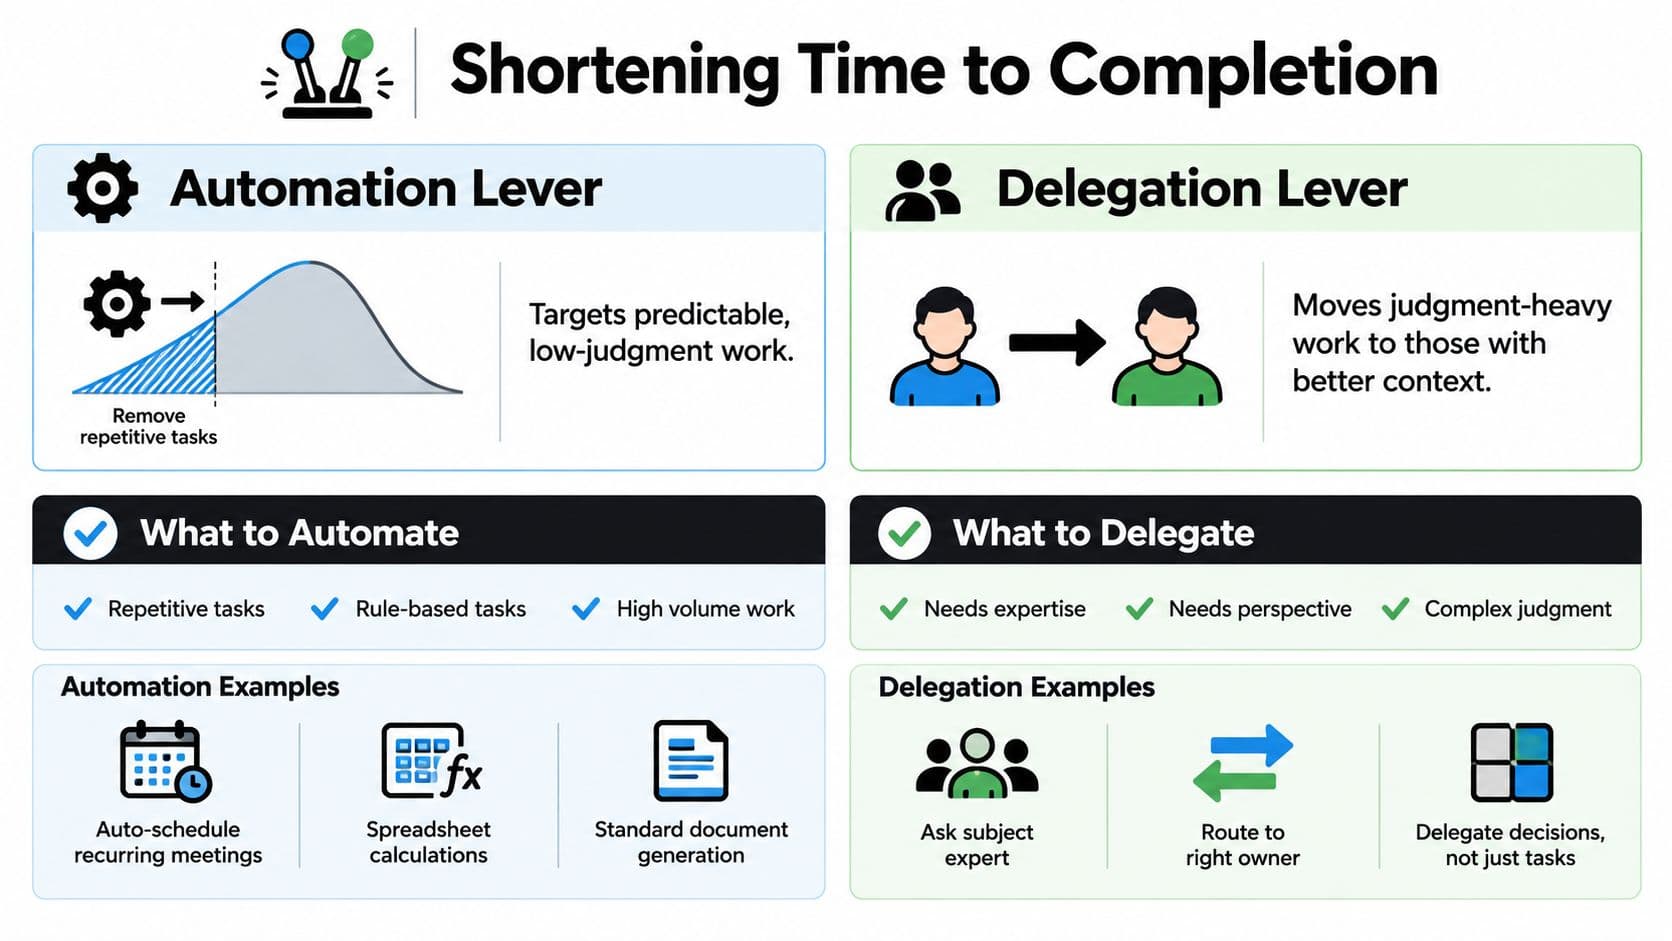
Start by separating work that repeats from work that requires judgment. A simple two-axis map helps. Put task frequency on one axis and task complexity on the other. Frequent, low-judgment work belongs near automation. Infrequent, high-judgment work belongs near a specialist or decision owner. Tasks that are both frequent and complex often need a hybrid workflow.
Use automation for predictable work
Automation is best for the repeatable part of a process:
- Routing an approval to the correct queue
- Drafting a standard reply from known information
- Generating a document from a controlled template
- Calculating fields in a spreadsheet
- Creating follow-up tasks after a status change
These changes reduce manual entry, retries, and avoidable handoffs, as detailed in this analysis of automation savings. They also make the lower part of the distribution steadier, because workers are not rebuilding the same sequence each time.
Use delegation for judgment-heavy work
Delegation targets the upper tail. A task can run long when one person lacks context, has to interrupt another project, or becomes the only reviewer for a growing queue. Moving the work to someone with the right expertise can break that serial bottleneck.
Delegate the decision, not just the keystrokes. A subject expert can resolve an ambiguous request, a coordinator can prepare information before review, and a legal specialist can handle work that should not be reduced to a generic template. A virtual legal assistant is one example of a specialist resource that can support defined administrative and legal workflow tasks.
Fluidwave combines task automation with delegation to human virtual assistants. It can auto-prioritize tasks, break larger work into smaller steps, route work for completion, and let users track delegated progress. The useful question is not whether the tool sounds efficient. It is whether the workflow removes a repeatable step, clarifies ownership, or shortens a known waiting state.
Measure both levers separately
Do not report one blended “productivity” number after changing a workflow. Record:
- The median before and after the change.
- A high-percentile completion value before and after the change.
- The number and duration of handoffs.
- The share of tasks requiring rework.
- The task types affected by automation or delegation.
The median shows whether ordinary work is moving faster. The upper tail shows whether the workflow still creates avoidable exceptions. Automation usually affects the predictable middle of the process. Delegation often prevents the slowest cases from becoming a bottleneck.
A Weekly Review to Keep Your Numbers Honest
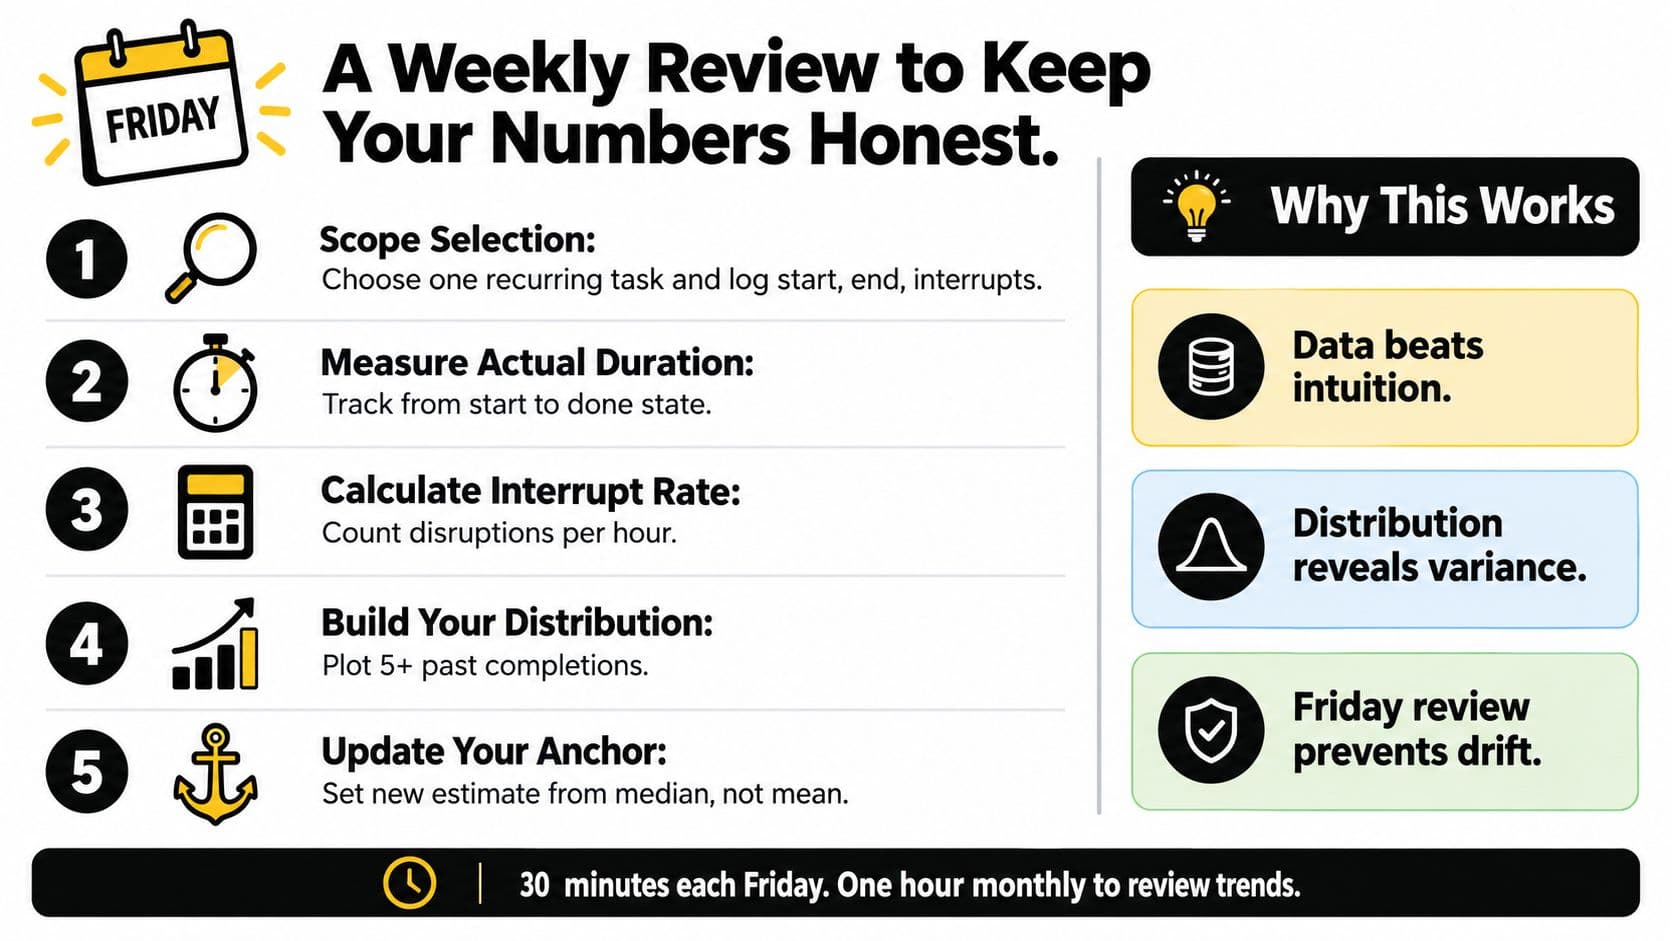
A weekly review should be short enough to repeat and strict enough to expose wishful estimates. Set aside roughly 30 minutes each Friday for one recurring task, not the entire operation. The aim is to create a clean comparison between last week's distribution and this week's result.
Run the review in five steps
-
Select one recurring task. Choose work that appears often enough to compare. Record the actual start, actual end, and number of interruptions. Don't mix a routine request with an exceptional project.
-
Instrument the work. Use a timer, task-management history, or workflow log. Start measurement at the trigger you defined and stop it at the defined done state. If the team can't reproduce the measurement, the number won't support a useful decision.
-
Automate one sub-step. Pick a small, repeatable action, even if the change saves only 90 seconds in the illustrative experiment. Record the baseline first, then note exactly where the automated step enters the workflow.
-
Delegate one preparatory step. Send a defined subtask to a team member, vendor, or AI assistant. Record when the handoff occurs, when the recipient starts, and when the prepared work returns. Handoff time is part of the process, not an administrative detail to ignore.
-
Compare distributions. Compare the new median and 90th percentile with the prior week's values. Note which lever changed the result, whether the task mix was comparable, and whether any outlier came from a new cause.
Keep the log for four weeks before changing the process again. One data point can reflect an unusual request or an unexpected absence. A run of comparable observations shows whether the workflow changed the typical duration, the slow tail, or neither.
Data beats intuition when the timestamps use the same start and end rules.
The Friday checklist is simple: pick one task, instrument it, automate one step, delegate another, and review the new numbers. Write down the result and the reason for any delay. That record gives the next estimate a base rate instead of another optimistic guess.
Fluidwave gives teams a way to organize tasks, auto-prioritize work, break larger tasks into smaller steps, and delegate defined work to virtual assistants while tracking progress. Visit Fluidwave to test whether its automation and delegation workflows can help reduce both routine completion time and the long tail of delayed tasks.
Focus on What Matters.
Experience lightning-fast task management with AI-powered workflows. Our automation helps busy professionals save 4+ hours weekly.