Build a reliable cost benefit analysis Excel template with clear steps, a worked example, and tips for discounting, sensitivity checks, and multi-year cash
September 4, 2026 (1mo ago)
Cost Benefit Analysis Excel Template: Build It Right
Build a reliable cost benefit analysis Excel template with clear steps, a worked example, and tips for discounting, sensitivity checks, and multi-year cash
← Back to blog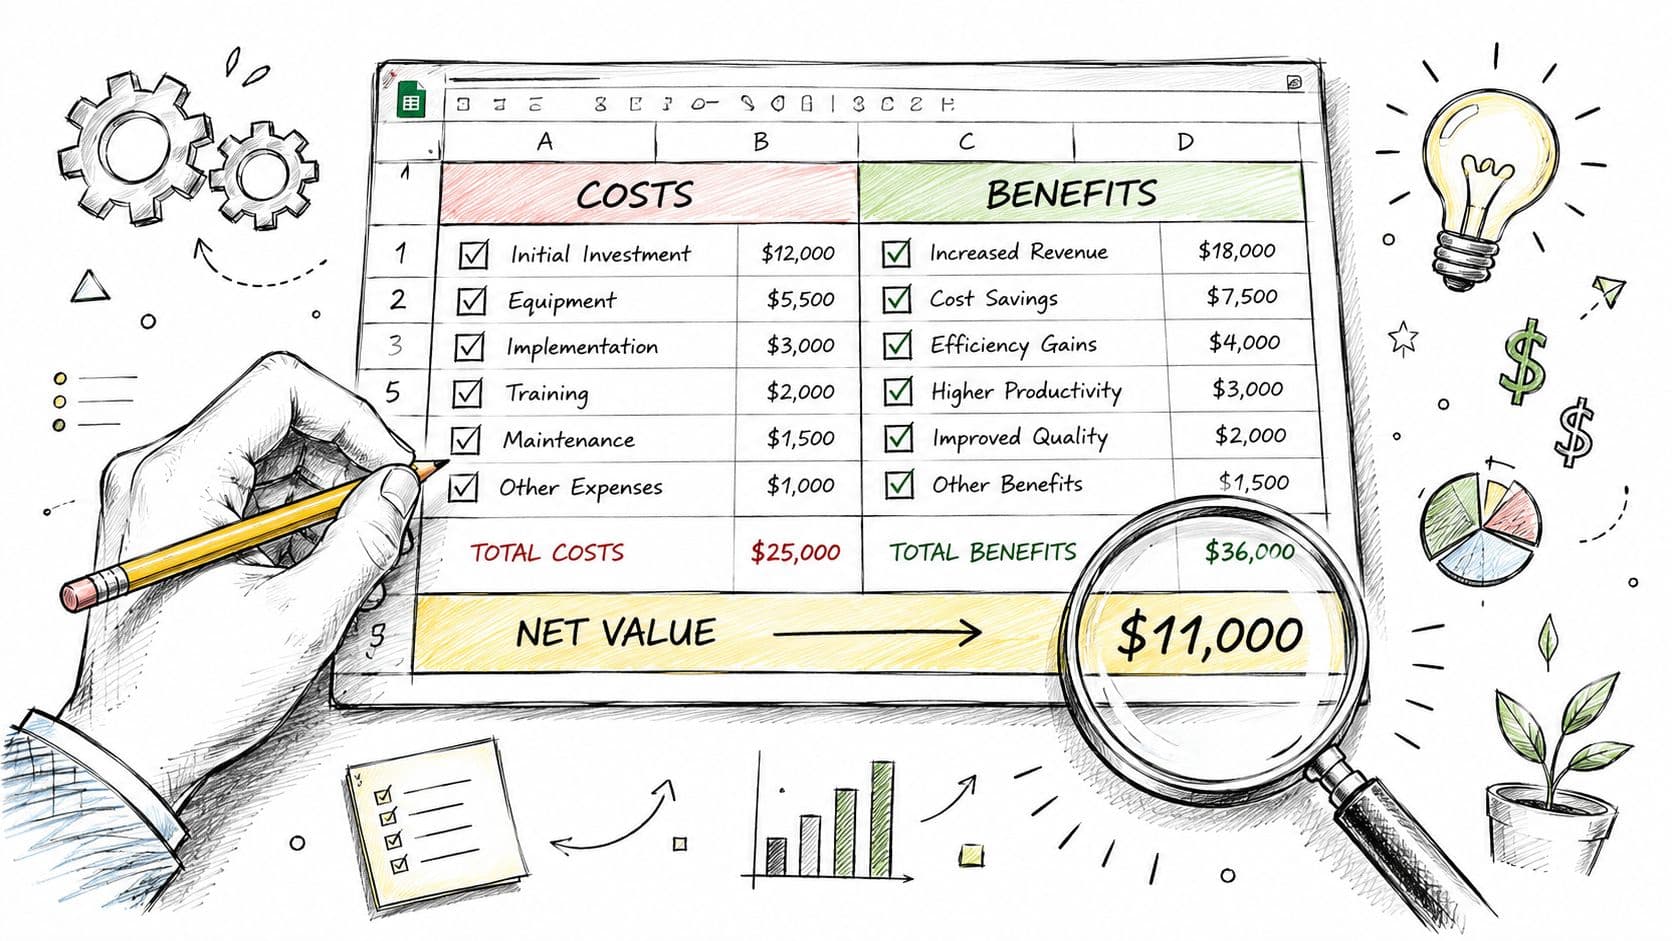
A founder has two vendor proposals open on the laptop. One costs $48,000 and promises a vague 20% productivity gain. The other costs $61,000, but the supplier has documented expected time savings, implementation effort, and ongoing fees. The decision looks numerical, yet the contest is between assumptions.
A well-built cost benefit analysis Excel template makes those assumptions visible. It separates cash costs from benefits, records the evidence behind each estimate, discounts future cash flows, and shows how the recommendation changes when a key input moves. That's more useful than a polished dashboard built on figures nobody can defend.
Why a Spreadsheet Still Earns Its Place
The founder in this scenario doesn't need another calculator. A simple online tool can compare total costs with total benefits, but it may hide the assumptions inside preset categories or formulas. A BI dashboard can display an attractive result, but it usually depends on a separate data model and may not show who entered a benefit estimate or why.
Dedicated capital budgeting software brings stronger controls, workflows, and portfolio reporting. Those features are valuable for large finance teams. For a small business or a single investment decision, they can also introduce licensing costs, implementation work, and a methodology that's harder for non-finance colleagues to inspect.
Excel earns its place because reviewers can trace the decision from an input cell to a calculation and then to the recommendation. Named ranges make formulas readable, change history can show how assumptions evolved, and scenario toggles let you compare conservative, base, and upside cases without accepting a vendor's model as the default. The spreadsheet format also has deep roots. Cost-benefit analysis was first developed in the 1840s by French economist and engineer Jules Dupuit, and by the 20th century it had become a standard method for public-policy and infrastructure evaluation. Modern templates carry the same logic into a spreadsheet, including models that total recurring and nonrecurring costs, revenues, and benefits across a 5-year horizon in the Virginia cost-benefit analysis Excel example.
Practical rule: Use Excel when transparency and adaptability matter more than automation at scale.
A spreadsheet still has two serious weaknesses. Manual formulas can break when someone inserts a row, changes a sign, or copies a reference incorrectly. Shared files also create collaboration problems, especially when several people edit different versions and nobody knows which workbook is authoritative.
The answer isn't to abandon Excel. It's to assign ownership to every tab, lock calculation areas, use structured tables, and keep a version log. For a plain-language explanation of the broader decision process, the Everglow Prosperity cost benefit analysis resource is a useful companion.
Setting Up the Workbook Foundations
Start with a Setup tab. Treat it as the control room, not a cover page. Every downstream calculation should pull its assumptions from this sheet rather than from scattered hard-coded values.
Establish the model identity
Record the project name, unique ID, sponsor, analyst, decision date, currency code, and a notes field describing the decision context. The notes should explain what approval is being requested, which alternatives are being compared, and what the analysis excludes.
Set the appraisal period in a named cell such as Appraisal_Period. Operational decisions often use a period of 3 to 7 years, while capital assets may be assessed over 15 years. These ranges are practical conventions for structuring a model, not automatic rules. The correct period should reflect the operating life of the project or asset.
Control time and valuation
Add a price base year, a real-versus-nominal flag, inflation input, tax input, and discount rate. The discount rate belongs in one clearly labeled cell, entered as a decimal, with a neighboring field identifying its source, such as WACC, a hurdle rate, or a Treasury yield.
For constant-dollar benefit-cost analysis, OMB Circular A-94 says to report net present value using a real discount rate of 7 percent. That rate may not apply to every private decision, so document why your chosen rate is appropriate. Reviewers should be able to challenge the rate without hunting through formulas.
Use names such as Discount_Rate, Base_Year, Inflation_Rate, and Tax_Rate. A formula reading =Benefits_PV-Costs_PV is easier to audit than one filled with cell coordinates. If you're building a reusable workbook, keep the input area structured like a small database, using the principles in this guide to create an Excel database.
Finish the tab with a validated project-status list: Draft, In Review, and Approved. Add a version log with columns for changed input, old value, new value, editor, date, and reason. That record often matters more than a decorative dashboard when a decision is revisited.
Building the Costs and Benefits Sheet
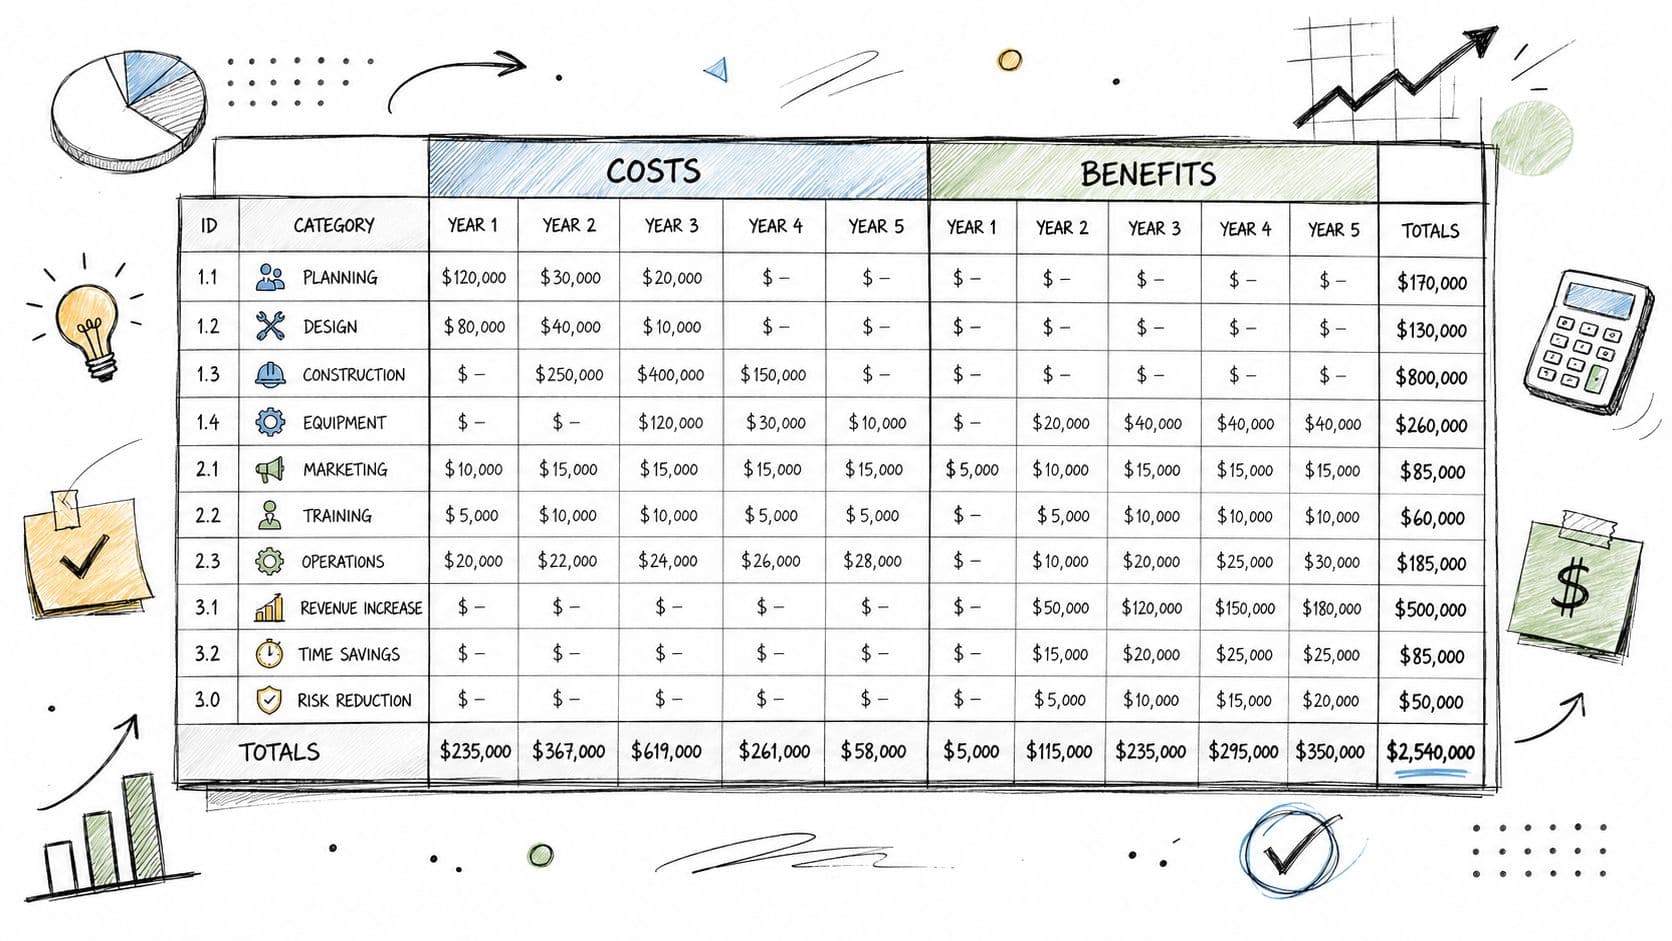
The main sheet should read like an evidence register with calculations attached. Use one row per line item and one column for each project year, rather than placing a single total beside a vague description.
Give every line item an owner
Include these fields:
- Line item ID: Use a stable identifier such as
C-001orB-001. - Category: Choose from CapEx, OpEx, one-time, recurring, direct benefit, or indirect benefit.
- Description: State what the amount represents and when it occurs.
- Evidence source: Record a quote, invoice history, internal benchmark, contract, or analysis note.
- Owner: Name the person responsible for validating the figure.
- Confidence rating: Use High, Medium, or Low.
- Timing columns: Add Year 0 through Year N and an in-period total.
Enter costs as positive numbers and keep a separate sign column. That approach preserves an intuitive view of spending while allowing the net cash flow formula to subtract costs cleanly. Put benefits in their own block, also as positive values, so reviewers can distinguish value creation from expenditure without interpreting negative numbers.
Create Excel Tables through Insert > Table. Name them tblCosts and tblBenefits. Structured references such as tblCosts[Amount] expand when new rows are added, reducing the risk that a new line is left outside the calculation range. Add data validation to category and confidence fields so one person doesn't enter “Recurring,” another enters “repeat,” and a third uses “annual.”
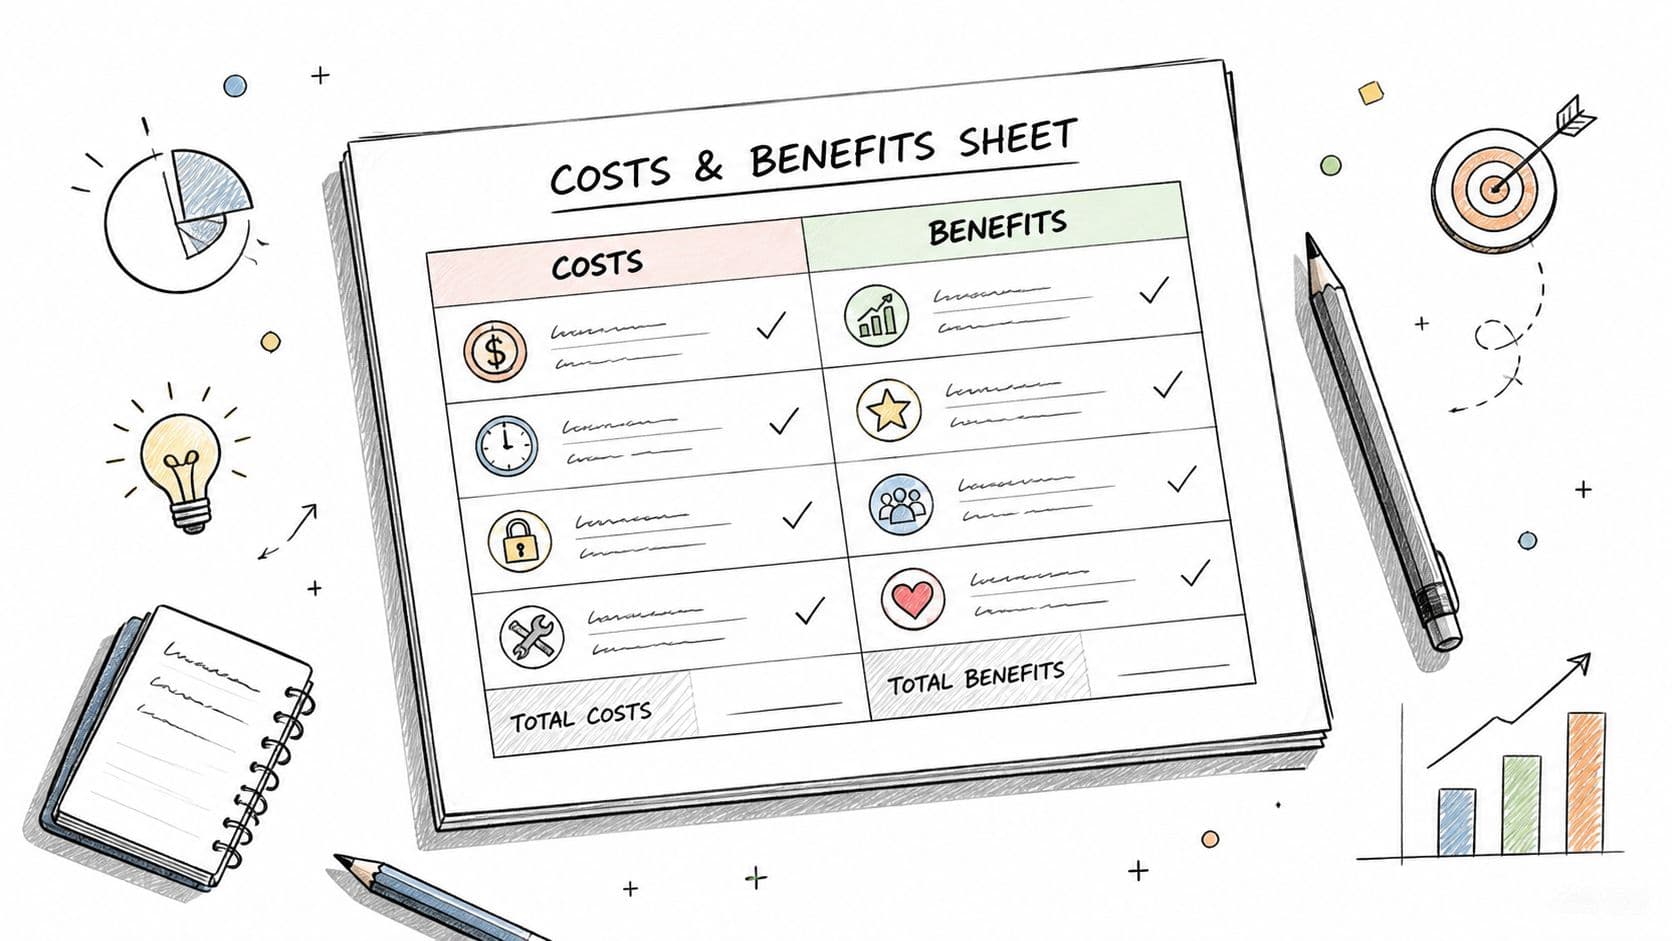
Place three summary cells above the tables: total costs, total benefits, and net cash flow before discounting. Use SUMIFS to filter by category and timing. These cells provide a basic sanity check before you apply time-value-of-money calculations. If total benefits are blank, or a recurring fee appears in Year 0 only, you want to catch that error here.
Audit habit: Never accept “productivity improvement” as a complete benefit description. State the activity affected, the measurable driver, the unit value, and the timing.
Formatting can reinforce the logic. Apply consistent colors to inputs, formulas, and outputs, but don't use color as the only control. A practical guide to color-coding in Excel can help you establish a visual convention. For decisions involving a recovery threshold, pair the model with a clear method to find your break even point, while keeping the CBA's discounted metrics separate from a simple operational break-even view.
Worked Example With Numbers
Consider a 5-year CRM migration with two vendors. The input sheet contains Year 0 implementation costs, recurring license fees, internal implementation hours, expected revenue uplift, and churn reduction. Each benefit has a driver and an evidence note. For example, revenue uplift might be linked to a sales forecast, while churn reduction should identify the customer data and retention assumption supporting it.
The calculation sheet converts each annual cost and benefit into discounted present value. Store the discount rate in the named cell Discount_Rate on the Setup tab. For dated cash flows, use XNPV with actual dates and XIRR for the corresponding return calculation. If the model uses evenly spaced annual periods, Excel's NPV function can follow the form =NPV(rate,value1,value2,...), with the initial cash flow handled according to the timing convention. A Tianjin University spreadsheet exercise demonstrates the mechanics of subtracting yearly costs from benefits, discounting future values, summing present values into NPV, and using Excel's NPV and IRR functions in its calculation exercise.
Use separate calculation blocks for discounted benefits and discounted costs. Then calculate BCR as total discounted benefits divided by total discounted costs. For undiscounted payback, build a cumulative net cash-flow column and identify the period in which it turns positive. If the turn occurs partway through a year, interpolate between the prior cumulative balance and the current period's net cash flow.
The summary sheet should pull only from the calculation sheet. That keeps presentation separate from the formulas and lets you change the layout without disturbing the model.
Vendor A versus Vendor B five-year CBA summary
| Metric | Vendor A | Vendor B |
|---|---|---|
| NPV | $148,000 | $112,000 |
| IRR | 22% | 17% |
| BCR | 1.41 | 1.27 |
| Payback | 2.8 years | 3.4 years |
Vendor A leads on every listed metric in this example, but the result still depends on the assumptions behind revenue uplift, churn reduction, implementation hours, and license costs. The table is a decision summary, not evidence that the forecast will occur.
Keep the formulas visible on a protected calculation tab, with input cells unlocked. Label the summary as nominal or real, state the appraisal period, identify the discount rate, and show whether payback is discounted or undiscounted. Those small labels prevent stakeholders from comparing metrics that were calculated under different conventions.
Discounting, Sensitivity, and Switching Values
A single NPV can create false confidence. The model should make it easy to test the assumptions that drive the result.
First, place the discount rate in Discount_Rate on the Setup tab and reference it absolutely in every discounting formula. In a row-based model, the discount factor for period t can be represented as =1/(1+Discount_Rate)^t. For dated cash flows, use the date-aware formulas on the calculation sheet and make sure the cash-flow dates are consistent.
Test the rate before defending the choice
Build a one-input Excel data table with these rates:
| Discount Rate | Vendor A NPV | Vendor B NPV | Preferred Vendor |
|---|---|---|---|
| 6% | Formula result | Formula result | Formula result |
| 8% | Formula result | Formula result | Formula result |
| 10% | Formula result | Formula result | Formula result |
| 12% | Formula result | Formula result | Formula result |
| 15% | Formula result | Formula result | Formula result |
The NPV cells should link to the summary output, not contain separate formulas. In the data table, the discount-rate input cell is Discount_Rate. The preferred-vendor column can use a comparison formula that returns Vendor A, Vendor B, or Tie.
The exact values in this table depend on the cash-flow schedule, so don't fill them with invented outputs. What matters is whether one vendor's lead survives a reasonable range of rates. If Vendor A leads only at the base rate, that's a materially weaker recommendation than a lead that persists across the tested range.
Rank the assumptions that matter
Create a tornado chart from manually varied cases for revenue uplift, implementation hours, and churn reduction. Hold all other inputs constant, calculate the resulting NPV for each low and high case, and rank the inputs by the size of their NPV swing. The chart should show decision exposure, not visual decoration.
Finally, use Goal Seek to set the selected vendor's NPV to zero by changing one assumption. You might solve for the discount rate, the required revenue uplift, or the maximum implementation cost. A switching value answers a practical question: how far can an assumption move before the project stops being attractive?
IRR is useful, but it compresses the cash-flow pattern into one rate. Switching-value analysis is often more candid because it identifies the break-even condition decision-makers can monitor after approval. Public-sector template guidance also recommends sensitivity, switching-value checks, and a quantified risk register, alongside documented assumptions, current prices, and an appraisal period that reflects the project or asset's operational life in its Excel template guidance.
Turning Indirect Benefits Into Defensible Numbers
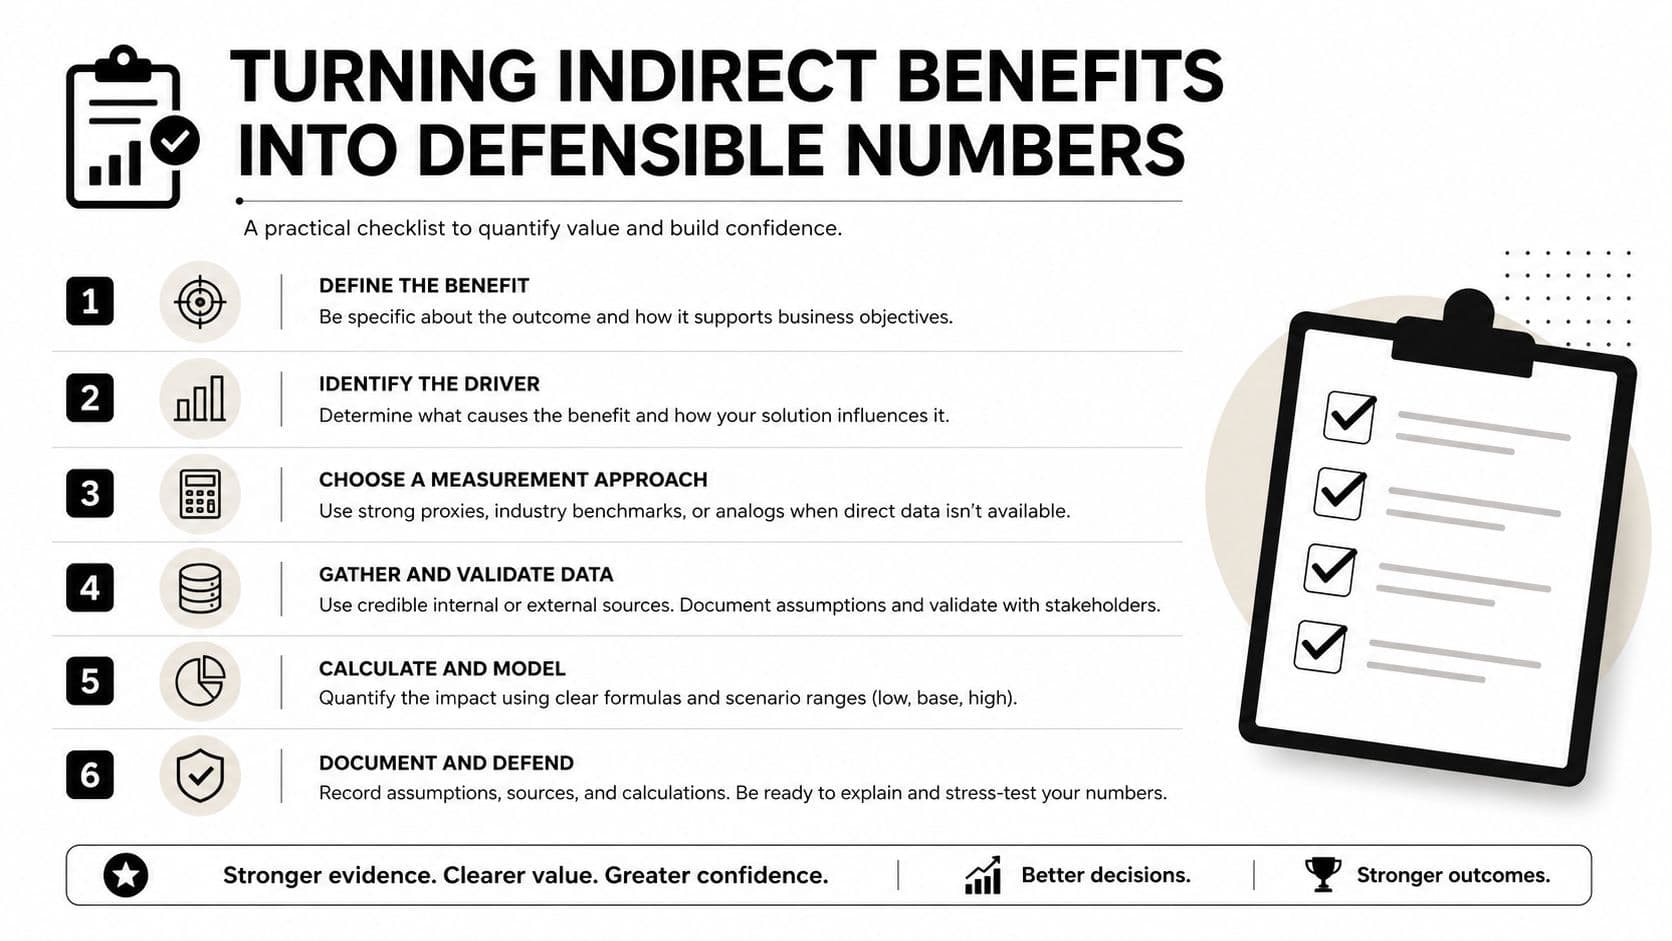
“Better morale” and “faster decisions” may matter, but they aren't usable benefit entries until someone explains how the project creates value. Listing them without a measurable proxy makes the workbook look optimistic and gives reviewers no way to test the estimate.
Use a consistent chain:
- Name the benefit: For example, reduced staff turnover.
- Identify the driver: Use an observable measure such as turnover, cycle time, or error rate.
- Select a unit value: Use a credible external source or an internal benchmark.
- Estimate annual quantity: State how many hours, incidents, or leavers the project affects.
- Apply confidence: Mark the line High, Medium, or Low and explain the judgment.
For reduced staff turnover, one possible valuation is 1.2 times annual salary per avoided leaver, provided your organization has evidence that supports that replacement-cost proxy. For faster decisions, multiply hours saved by the fully loaded labor cost of the people affected. For reduced compliance incidents, use the expected cost of one avoided audit finding, including remediation and internal effort where those costs can be evidenced.
The point isn't to turn every human outcome into fake precision. It's to distinguish a cash benefit, a cash-equivalent benefit, and a strategic benefit. New Zealand Treasury's CBAx is described as a spreadsheet model with a database of values intended to help agencies monetize impacts and perform cost-benefit analysis through its CBAx model description.
Put the confidence tag beside the dollar figure, not in a separate memo. That placement lets a reviewer filter low-confidence benefits, exclude them from a conservative case, or apply a deliberate adjustment. The workbook becomes more credible when uncertainty is visible rather than hidden behind a precise-looking total. For a broader measurement mindset, see this practical guide on how to measure anything.
Automating and Delegating the Heavy Lifting
The decision-maker shouldn't be the person chasing every vendor quote, cleaning every historical extract, and repairing every broken reference. Keep judgment manual, but standardize data collection and delegate repeatable checks.
Use data validation and named ranges so a junior analyst can add costs without changing formulas. Split the workbook into Input, Calculation, and Output tabs. Protect the calculation sheet, allow editing only in approved input cells, and make the output page suitable for a review meeting. Power Query can pull historical spending into the costs table, while Goal Seek can run break-even checks without manually rewriting assumptions.
A shared cloud file needs a refresh rhythm and an owner. Schedule a weekly review of open inputs, record a short Loom walkthrough of the named ranges, and maintain a checklist for vendor quotes, headcount savings, revenue assumptions, and risk adjustments. Public-sector organizations continue to distribute spreadsheet-based tools, including USDOT's template as a convenience and FEMA's downloadable Excel BCA Toolkit, which users are instructed to save locally and use through Excel Online or desktop Excel. Those examples reinforce the value of a controlled workbook, even when the template isn't mandatory in this overview of cost-benefit analysis templates.
CBA task delegation matrix
| Task | Suggested Owner | Review Cadence | Notes |
|---|---|---|---|
| Vendor quotes | Procurement lead | At each quote update | Attach quote date and scope |
| Historical spending | Finance analyst | Weekly during model build | Refresh through Power Query where practical |
| Implementation hours | Delivery manager | At milestone review | Separate internal and external effort |
| Headcount savings | Functional manager | Monthly during validation | Record affected roles and timing |
| Revenue assumptions | Sales or commercial lead | At forecast revision | Link to the approved forecast |
| Risk adjustments | Finance lead | Before decision approval | Keep the risk register separate from base case |
| Formula checks | Model owner | Before every circulated version | Test totals, signs, dates, and named ranges |
| Report formatting | Analyst | Before decision meeting | Pull outputs from calculations only |
A reusable workbook works best when each task has one accountable owner and one review point. Don't let “the team” own a number. A named person should be able to explain its source, update it, or recommend removing it.
Fluidwave can help you delegate the research, data gathering, formula checks, and recurring review tasks that support a defensible CBA workbook. Visit Fluidwave to organize those assignments, set budgets and timelines, and keep the work moving without pulling the decision-maker into every administrative step.
Focus on What Matters.
Experience lightning-fast task management with AI-powered workflows. Our automation helps busy professionals save 4+ hours weekly.