Creating an excel database - Go beyond simple lists. Learn how to structure a robust system by creating an Excel database that is scalable, easy to maintain,
May 9, 2026 (1mo ago)
A Guide to Creating an Excel Database in 2026
Creating an excel database - Go beyond simple lists. Learn how to structure a robust system by creating an Excel database that is scalable, easy to maintain,
← Back to blog
You probably have a spreadsheet already. It started as a simple list of clients, tasks, leads, invoices, or content ideas. Then someone added colors, another person inserted a few helper columns, and now the sheet sort of works as long as nobody touches the wrong cell.
That's the point where many typically start searching for help with creating an Excel database.
Excel is still one of the fastest ways to build a useful internal system when your team needs something now, not after a long software rollout. I've seen it work well for project tracking, lightweight CRM setups, operations logs, inventory lists, and approval queues. I've also seen people turn a worksheet into a fragile mess because they skipped the design decisions that matter.
A good Excel database isn't fancy. It's structured, boring in the right places, and easy to trust. If you build it with clear tables, controlled input, a sane lookup structure, and a plan for scale, you can get most of the value of a small database without the overhead of buying one too early.
Plan Your Database Before You Type Anything
Most broken Excel databases fail before row one.
The usual pattern is familiar. Someone opens a blank workbook, types a few headers that feel right, merges a title across the top, adds a yellow fill for “important” cells, and starts entering live data. A week later, they realize they need due dates, owner names, categories, and status rules. Then come the duplicate columns, inconsistent labels, and endless cleanup.
Five minutes of planning saves hours of repair work later. That matters even more if your brain gets overloaded by visual clutter or too many decisions at once.

Start with the job the database must do
Before you create columns, answer one question.
What is this database for?
Not “general tracking.” Not “operations.” Name the exact job. Examples:
- Client work tracking for active projects, owners, deadlines, and next actions
- Task management for personal or team execution
- Sales logging for lead status, contact history, and next follow-up
- Request intake for collecting work from other people in a consistent format
Once that's clear, define the record. One row should represent one thing only. In a task database, one row is one task. In a client database, one row is one client. Mixing task rows with project summary rows in the same table is where trouble starts.
Think in fields, not in screen layout
A database structure is just a simple schema. In plain language, that means deciding what information belongs in each row and what doesn't.
A practical test helps:
| Question | Keep it as a column | Do not keep it as a column |
|---|---|---|
| Does every row need it? | Yes | No |
| Can one clear rule define it? | Yes | No |
| Will people filter, sort, or report on it? | Yes | Probably not |
| Is it just decoration? | No | Yes |
A strong starter set for a task database usually includes:
- Unique ID like TASK-001
- Task name with plain language
- Owner
- Status
- Due date
- Priority
- Project or client
- Notes
That's enough to run a lot of work.
Practical rule: If a column exists only because “it might be useful someday,” leave it out for now.
Design for your brain, not just for Excel
This is the part most guides ignore. A database can be technically correct and still be hard to use.
For neurodivergent knowledge workers, especially people with ADHD, structured databases can reduce cognitive load by 40% when they use pre-set views, according to Microsoft accessibility guidance referenced here. That matters because Excel's grid can feel noisy fast.
A few design choices help immediately:
- Use one clean intake area for messy thoughts. A “brain-dump” sheet works well when you need to capture tasks quickly before sorting them.
- Create a Today view by filtering status, due date, or owner instead of staring at the full database.
- Use color sparingly for urgency or blocked status, not for decoration.
- Keep status choices short so your filters stay readable.
- Avoid merged cells because they make navigation and analysis worse.
To ensure your process survives handoffs, defining rules outside the file is essential. A simple operating procedure maintains database consistency when multiple people manage it. A documented workflow like how to create standard operating procedures becomes useful for this purpose.
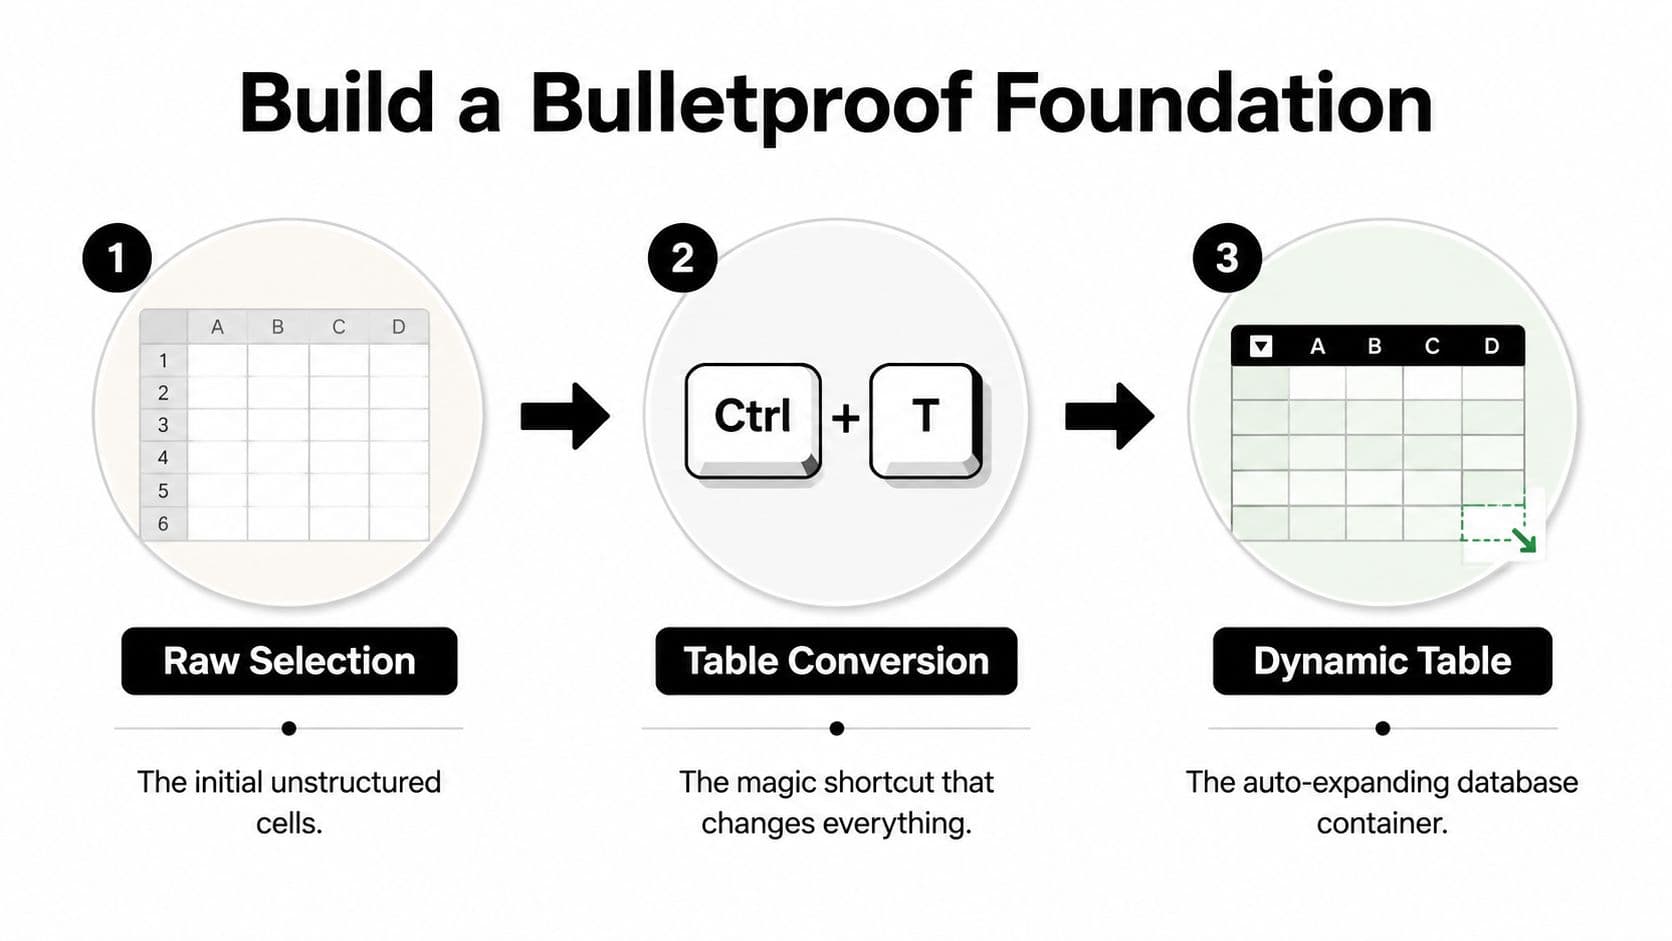
Build a Bulletproof Foundation with Excel Tables
If you do only one technical thing right, do this.
Convert your data range into an Excel Table with Ctrl+T.
That shortcut turns a loose worksheet range into a structured object that expands with new rows, carries formulas down automatically, and behaves properly with filters, PivotTables, and formulas. Excel Tables were introduced in 2007, and they're still the line between a usable database and a spreadsheet that slowly collapses under its own shortcuts. According to this Excel database guide, formatted tables improve the accuracy of AI-driven Analyze Data insights by 75%, while merged cells account for 30% of analysis failures. The same source notes that dynamic PivotTables built on structured data can reduce manual reporting time by 60% in enterprise settings.
Convert the range properly
A clean setup looks like this:
- Put your headers in a single row.
- Remove blank rows inside the data.
- Click anywhere in the range.
- Press Ctrl+T.
- Confirm My table has headers.
- Rename the table in the Table Design tab. Use something clear like
TasksorProjects.
That last step matters more than people think. A table named Table1 tells you nothing six weeks later.
Why tables fix so many common problems
Excel Tables solve several issues at once:
- New rows inherit formulas automatically
- Filters stay attached to the dataset
- References become readable
- Charts and PivotTables handle expansion better
- Formatting stays consistent
The biggest shift is conceptual. You stop thinking in cell coordinates and start thinking in fields.
Instead of this:
=COUNTIF(C2:C500,"Complete")
You can use this:
=COUNTIF(Tasks[Status],"Complete")
That's a structured reference. It's easier to read, easier to debug, and much less fragile when your table grows.
A worksheet range says where the data is today. A table says what the data is.
Add rules before people start typing
A database without input control gets messy fast. Typos in status labels break filters, formulas, and reports. “In Progress,” “In progress,” and “In-Progress” are not the same value to Excel.
Use Data Validation on columns that need consistency. A simple task table usually benefits from validation on:
- Status with options like Not Started, In Progress, Complete
- Priority with options like High, Medium, Low
- Owner from a team list on a separate sheet
- Category from a short approved list
You don't need to validate every column. Validate the fields that people will group, filter, or summarize later.
A simple foundation that holds up
Here's a good starter structure for a task database:
| Column | Purpose | Rule |
|---|---|---|
| TaskID | Unique identifier | Never blank |
| TaskName | Main description | Plain text only |
| Status | Workflow stage | Data Validation list |
| Owner | Responsible person | Choose from team list |
| DueDate | Deadline | Real date format |
| ProjectID | Link to project table | Must match project list |
This is not glamorous work. It is the work that prevents silent errors later.
If creating an Excel database feels harder than it should, it's usually because the sheet was treated like a document instead of a table-based system.
Connect Data Intelligently with Lookups
A lot of Excel databases become unusable because everything gets shoved into one giant sheet.
You don't need project name, client name, client email, project owner, billing type, region, and task details repeated on every task row. Repeated data creates drift. Someone updates one project name in row 14 and forgets the same project appears in rows 38, 61, and 204.
A better pattern is simple. Keep separate tables for separate things, then connect them with lookups.
Use two smaller tables instead of one bloated one
A practical setup:
Projects table
| ProjectID | ProjectName | Client | ProjectOwner |
|---|---|---|---|
| P-001 | Website Refresh | Northwind | Maya |
| P-002 | Sales Deck | Alpine | Jordan |
Tasks table
| TaskID | TaskName | ProjectID | Status | DueDate |
|---|---|---|---|---|
| T-001 | Draft homepage copy | P-001 | In Progress | |
| T-002 | Review slide outline | P-002 | Not Started |
Now the task table stores the ProjectID, not the full project details on every row.
Pull details in only when needed
If you want the project name visible in the Tasks table, use XLOOKUP.
Example:
=XLOOKUP([@ProjectID],Projects[ProjectID],Projects[ProjectName],"")
That formula says: take the current row's ProjectID, find it in the Projects table, and return the ProjectName.
You can do the same for client, owner, or any other field that belongs in the Projects table.
Why this works better:
- You update data once
- You reduce duplicate typing
- You make reports more reliable
- You keep the main task table narrower
What works and what doesn't
People often overcomplicate things. Keep the lookup pattern boring.
What works well:
- One ID column in each table
- Stable IDs that don't change
- Separate tables for projects, contacts, tasks, or products
- XLOOKUP for bringing in display values
What causes trouble:
- Looking up by project name instead of ID
- Manually typed names with spelling variations
- Circular dependencies between tables
- Repeated helper columns no one understands
If the value can change, don't use it as your key. Names change. IDs should not.
If you don't have XLOOKUP, older workbooks can use VLOOKUP or INDEX-MATCH. But if you have modern Excel, XLOOKUP is cleaner and easier to maintain.
This is the closest many groups need to “relational database design” inside Excel. It's enough to keep your workbook organized without dragging you into full database theory.
Automate Your Data Entry and Workflows
Typing directly into the main table is where many Excel databases start to go wrong.
People overwrite formulas. They paste values into the wrong columns. They add notes inside date fields. Then someone sorts one column without expanding the selection and the whole file turns into forensic evidence.
The fix is to separate data entry from data storage.

Use forms whenever possible
If your workbook lives in OneDrive or SharePoint, Microsoft Forms is one of the cleanest intake tools available. You create a form, collect responses, and feed them into Excel in a controlled format. For request logs, issue tracking, task submissions, and internal intake, this is much safer than asking people to edit the workbook itself.
For desktop-heavy setups, Excel also has a built-in Form feature that many people never use. It's old-school, but it works well for entering one record at a time into a structured table.
The principle is the same in both cases. Let people submit fields through a controlled input layer, then let the table hold the records.
Pair forms with table logic
At this point, the system starts to feel dependable.
A solid setup usually includes:
- An input form for new records
- An Excel Table as the storage layer
- Formula columns that calculate flags, aging, or urgency
- Filtered views for different users or use cases
- Optional Power Query or VBA when the process gets repetitive
Advanced Excel automation with VBA or Power Query can create self-updating systems, and an automated data entry form combined with structured tables and formula automation can save organizations approximately four hours per week in data management tasks, according to this implementation-focused walkthrough. The same source notes that Excel's Data Model can integrate multiple tables into a single relational data source inside one workbook.
Keep the automation modest
You do not need a giant macro library to make this worthwhile.
Start with small wins:
- Auto-generate a priority flag from due date rules
- Fill helper columns automatically with structured formulas
- Use the Tab key for faster row-by-row entry
- Create filtered worksheets or saved views for active items only
A practical example for urgency is a simple formula-based label in a helper column. If a task is near deadline, mark it High. If it's further out, mark it Low. That gives people a useful default without asking them to think through priority every time.
Working rule: The best automation removes repeated decisions, not just repeated clicks.
If your team has recurring handoffs or approvals, the bigger gain often comes from tightening the surrounding process, not just the spreadsheet itself. A workflow only feels automatic when the intake, routing, and follow-up steps are consistent. That's why it helps to look at systems beyond the worksheet, like how to automate workflows.
Analyze and Summarize Your Data with PivotTables
Once the database is clean, Excel gets a lot more useful.
A good PivotTable can answer operational questions in minutes without adding a forest of formulas. You can take a flat task list and quickly see who owns the most open work, which projects are slipping, or how many requests came in this week versus last week.

Ask business questions, not spreadsheet questions
The strongest PivotTables start with a plain-language question.
Examples:
- How many tasks are assigned to each person?
- Which projects have the most overdue items?
- How many requests were completed this month?
- What's the average completion time by project?
If your source data is in a proper table, building the pivot is straightforward. Select any cell in the table, go to Insert > PivotTable, and place fields into Rows, Columns, Values, and Filters.
A few useful combinations:
| Question | Rows | Values | Filter |
|---|---|---|---|
| Tasks by owner | Owner | Count of TaskID | Status |
| Open tasks by project | Project | Count of TaskID | Status not Complete |
| Due items by week | DueDate grouped | Count of TaskID | Owner |
Add slicers for less friction
A lot of people stop at the PivotTable itself. Add Slicers and it becomes much easier for non-Excel people to use.
Slicers work especially well for fields like:
- Status
- Owner
- Project
- Priority
One click, and the report changes without anyone touching the underlying formulas.
Use the Analysis ToolPak for small-dataset validation
Sometimes you need more than counts and sums. If you're checking small datasets for data quality, basic distribution, or outliers, Excel's Analysis ToolPak is still useful.
The Analysis ToolPak was introduced with Excel 5.0 in 1993, and it can generate descriptive statistics without manual formulas. A 2023 study found that for datasets under 1,000 rows, 68% of analyses rely on the ToolPak for initial database validation, and it can speed up data cleaning by 40% to 50% compared with manual methods, according to this walkthrough discussing the ToolPak workflow.
If you haven't used it, enable it in Excel's Add-ins settings, then open Data Analysis from the Data tab and choose Descriptive Statistics.
Here's a short video if you want to see PivotTable basics in action before building your own report:
The key point is simple. Don't build reports by hand if the database already contains the answers.
Scale Your Database with Power Query
Many people assume the answer to a slow workbook is “be more careful with formulas.”
Usually, that's not enough.
If you're copying data from multiple files, cleaning the same columns every week, pasting exports from another system, or appending monthly reports by hand, the problem isn't just workbook discipline. The problem is that you're using the worksheet as a processing engine. That's the wrong layer.
Power Query handles the messy part upstream
Power Query lets Excel import, reshape, clean, and combine data before it lands in your visible sheets.
That changes the workflow completely.
Instead of this:
- download files
- open each one
- copy and paste
- fix date formats
- remove blank rows
- standardize names
- rebuild reports
You can move toward this:
- connect to the source files
- define the cleaning steps once
- refresh when new data arrives
That's a different class of Excel work. Less clerical effort, fewer broken formulas, and fewer “which version is correct?” moments.
Where Power Query helps most
It shines in a few situations:
- Monthly folder imports where every file has the same layout
- CSV exports from other systems that always need cleanup
- Merging multiple worksheets into one reporting table
- Separating raw data from reporting sheets
The practical advantage is stability. Your visible workbook becomes thinner because the cleanup logic lives in the query steps, not spread across helper columns and ad hoc formulas.
Power Query is what you use when your spreadsheet keeps asking you to do the same cleanup job again.
A better answer to growth pains
If your database is growing and the workbook feels heavy, Power Query often buys you time before you need a bigger platform.
That doesn't mean it solves every scale problem. It means it gives you a cleaner architecture:
| Old habit | Better pattern |
|---|---|
| Copy and paste raw exports | Load with Power Query |
| Fix data manually each week | Save transformation steps |
| Keep everything in one sheet | Separate raw, model, and report layers |
| Rebuild summaries every cycle | Refresh and review exceptions |
If you regularly pull schedules or event data into Excel, a workflow like exporting Google Calendar data to Excel is a good example of where Power Query can reduce repetitive cleanup.
Power Query doesn't make Excel infinite. It does make Excel much less fragile.
Know When to Graduate from Your Excel Database
Excel is excellent at “good enough” systems.
It is not a permanent answer to every data problem. A well-built workbook can carry a small team surprisingly far, but there's a point where staying in Excel costs more than moving on.
The hard part is that most tutorials never tell you where the line is.
The warning signs are operational, not philosophical
You've probably outgrown Excel when one or more of these starts happening regularly:
- Refreshes take too long
- People edit the same file and create conflicts
- Permissions matter beyond simple file access
- Data comes from too many sources
- The workbook has become part database, part app, part reporting layer
The biggest technical warning sign is size and complexity. While Excel has a theoretical limit of over a million rows, practical performance degrades sharply after 50,000 to 100,000 rows, especially with complex formulas and PivotTables, according to this discussion of real-world scaling limits. The same source notes that many tutorials ignore the fact that people can spend 60% of their time on data tidying once larger datasets get involved.
That doesn't mean you must leave Excel at row 50,001. It means you should stop pretending the workbook will scale forever.
What to use instead
The right next step depends on what broke first.
| Problem | Better next tool |
|---|---|
| Multi-user process tracking | Dedicated work management platform |
| Heavy reporting across sources | Power BI or a BI stack |
| Structured relational data | SQL database |
| Role-based permissions and audit needs | Database or line-of-business app |
Sometimes the next move is not “replace Excel” but “connect Excel to something stronger.” That's common when analysts still want Excel for ad hoc work but the core data belongs in a proper system.
In real estate operations, for example, teams often start in spreadsheets and then outgrow them once underwriting, assumptions, and version control become too complex. A useful example of that shift is PropLab's guide to AI underwriting, which shows how specialized tools become necessary when spreadsheet workflows stop being trustworthy enough for decision-making.
Graduation is a success signal
A lot of people treat migration as failure. It isn't.
If your Excel database got your business through its first phase, did the job, and exposed what your team really needs, it worked. You learned the fields, the workflow, the bottlenecks, and the reports that matter. That knowledge makes the next system better.
What doesn't work is forcing Excel to act like a full CRM, a secure multi-user database, and a business intelligence platform all at once.
The best time to leave Excel is when the workbook has become a maintenance project instead of a tool.
If you want a cleaner way to manage tasks, reduce cognitive overload, and automate follow-up work without building everything by hand in spreadsheets, Fluidwave is worth a look. It combines structured task views, automation, and human delegation support in a way that fits how busy professionals work.
Focus on What Matters.
Experience lightning-fast task management with AI-powered workflows. Our automation helps busy professionals save 4+ hours weekly.