Feeling stuck on quantifying results? Learn how to measure anything from brand awareness to team morale with this practical, actionable guide.
April 5, 2026 (3mo ago)
How to Measure Anything: A Guide for Modern Professionals
Feeling stuck on quantifying results? Learn how to measure anything from brand awareness to team morale with this practical, actionable guide.
← Back to blog
Trying to put a number on 'team morale' or 'brand awareness' can feel like chasing smoke. It's a common frustration, and most of us just assume these concepts are simply unmeasurable. But what if the goal wasn't to find a perfect, exact number?
The secret is to change your objective: instead of seeking certainty, you should aim to reduce your uncertainty. You absolutely can quantify anything once you accept this shift. It all starts by defining what you don't know and then taking small, focused steps to know a little more.
The Real Secret to Measuring Intangibles
We’re conditioned to think of measurement as a precise, definitive act. We see a ruler providing an exact length or a scale giving a specific weight. When we apply that thinking to fuzzy concepts like "innovation" or "customer satisfaction," we hit a wall and declare it impossible.
Here’s the game-changing idea: Measurement isn't about eliminating uncertainty, it's about chipping away at it. Even a small reduction in what you don’t know gives you a massive advantage in making better decisions. This is the core principle that unlocks your ability to measure just about anything.
Moving From Gut Feel to Data
We all make big calls based on gut feelings, but our intuition is often surprisingly unreliable. Our confidence in our own estimates is frequently misplaced. The key is to trade those vague feelings for a more structured method, even if the data you start with seems minimal.
It’s a simple, powerful loop: define the problem, gather observations, and act on the new information.
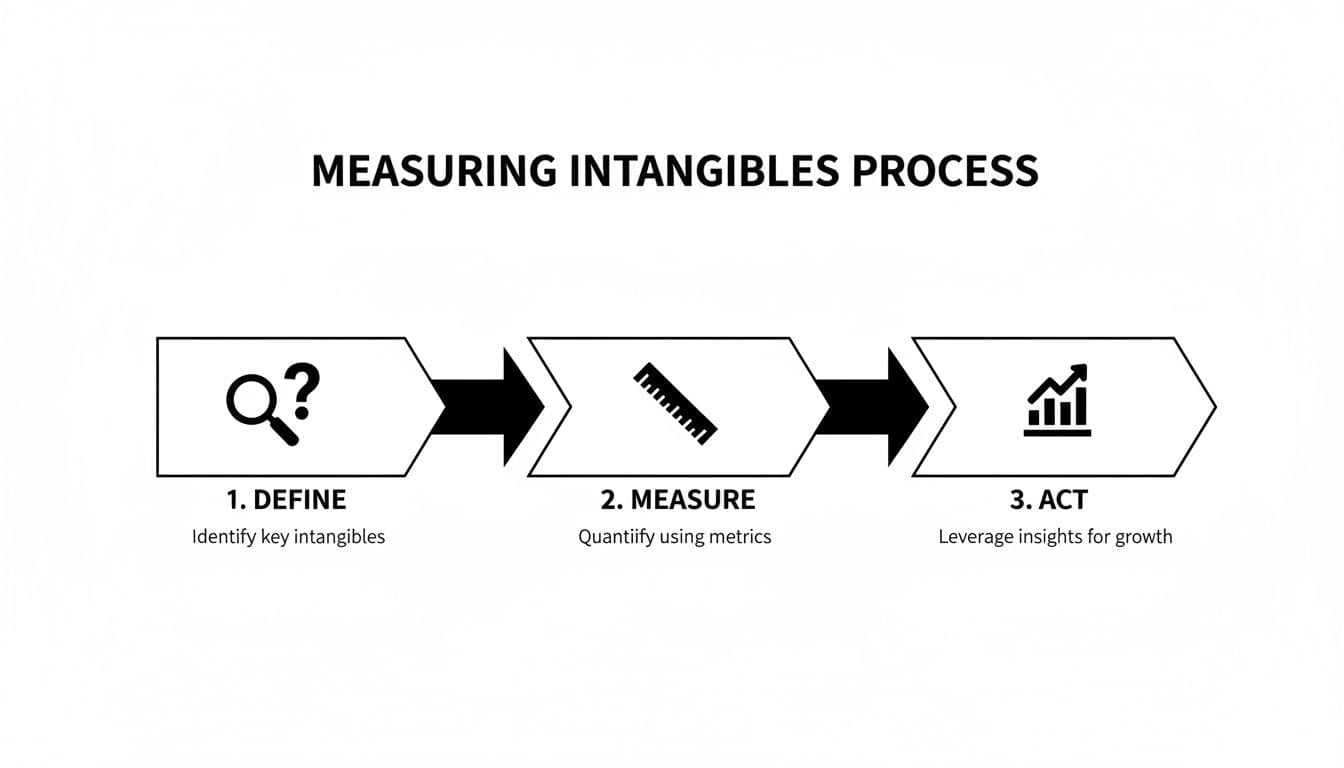
This framework isn't a one-and-done calculation. It's a continuous cycle of improvement that helps you make progressively smarter choices. To give you a clearer picture, here’s a quick summary of how this process works in practice.
A Framework for Measuring Intangibles
| Phase | Objective | Example Application (Measuring Team Morale) |
|---|---|---|
| Define | Clearly state the decision you need to make and what uncertainty is blocking you. | Decision: Should we invest in a new team-building program? Uncertainty: We don't know if current morale is low enough to justify the cost. |
| Measure | Identify observable proxies for the intangible. Collect data to reduce your uncertainty. | Proxies: Employee turnover rate, absenteeism, survey responses (e.g., eNPS), and participation in voluntary company events. |
| Act | Use the new data to make a more informed decision and iterate. | Action: The data shows a 15% drop in eNPS and increased absenteeism. We decide to pilot the program with one team and measure the same proxies again in three months. |
This table shows how a vague concept like "team morale" becomes a series of concrete, measurable questions that guide you toward a better business outcome.
Douglas Hubbard, a pioneer in this field, truly changed the game by framing measurement as the quantitative reduction of uncertainty. His research uncovered a startling "calibration error" in professionals: when asked to give 90% confidence intervals for facts, their ranges only held the true value about 60% of the time. This shows just how much we overestimate our own knowledge. You can find more on this in his work, which is well-summarized on platforms like Shortform.
"Anything can be measured. If a thing can be observed in any way at all, it lends itself to some type of measurement method. No matter how 'fuzzy' the measurement is, it’s still a measurement if it tells you more than you knew before."
Why This Mindset Matters
Adopting this approach is critical for making smart choices without getting stuck in "analysis paralysis." Think about these common situations:
- Prioritizing Projects: Is it better to invest in Feature A or Feature B? Instead of guessing, you can measure proxies for potential impact, like the volume of user requests or estimated time saved per user.
- Marketing Budgets: Should you spend more on social media ads or content marketing? Measuring the uncertainty around the ROI of each channel helps you allocate funds more intelligently.
- Hiring Decisions: Is a new team member improving workflow? You can observe and quantify changes in things like project completion times or peer-review error rates.
For professionals using a platform like Fluidwave, this thinking is built right into the workflow. The system helps you automatically prioritize tasks based on AI-driven uncertainty reduction, which can save you more than four hours per week. It works by making sure you're always focused on the initiatives that will deliver the most value, turning abstract goals into a series of clear, measurable steps.
It’s tempting to jump straight into the numbers. We often ask ourselves, "How can I measure our team's productivity?" or "What's the best way to track brand sentiment?" But this is putting the cart before the horse, and it's a trap I've seen countless professionals fall into.
Before you can measure anything meaningful, you have to know why you're measuring it. The real starting point isn't a metric; it's a decision.
Here's a simple truth: if a measurement won't change your mind or influence a choice, it’s just trivia. It’s data for data’s sake. The most crucial first step is to stop asking, "What should I measure?" and start asking, "What decision am I trying to make?"
The Clarification Chain
I've found the best way to gain this focus is through a simple technique called the clarification chain. It’s a powerful way to cut through ambiguity and connect a fuzzy problem to something concrete and observable.
Here’s how it works:
- What’s the problem? Start with the vague feeling or concept that’s worrying you. Let's say, "Our team's workflow feels inefficient."
- How would you notice it? If it’s real, it must have observable effects. You might see projects consistently running late or notice team members seem burned out.
- What decision does this prompt? What specific action are you considering to fix this? For example, "Should we invest in new collaboration software?"
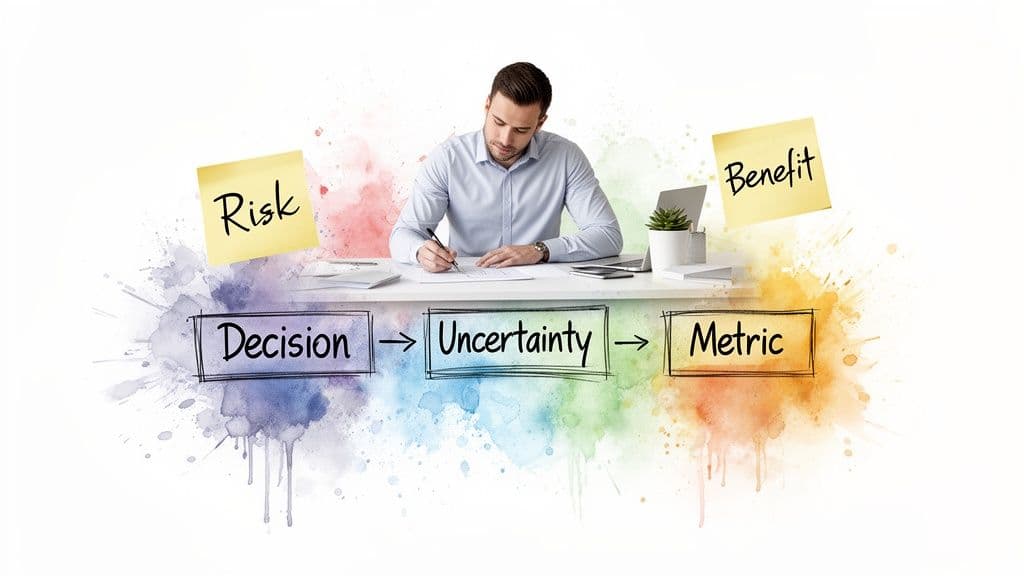
- What’s making the decision hard? Pinpoint the critical piece of information you're missing. Maybe it’s, "I'm not sure the benefits of the new software will justify the cost and the disruption of training."
That last point—the uncertainty—is exactly what you need to measure. You've just turned a vague worry about "workflow" into a focused question about the ROI of a specific software investment. The complex world of intangible outcomes and difficult trade-offs often becomes much clearer when you focus on the decision at hand.
From Vague Problem to Actionable Metrics
Let’s stick with that real-world scenario. You're a project manager, and your gut is telling you the current workflow is slow. You’re eyeing a new, pricey piece of collaboration software.
Your initial, unhelpful question was: "How do I measure team efficiency?"
But after using the clarification chain, you now have a razor-sharp decision to make: "Should we spend $20,000 on this new software?"
This immediately highlights the trade-offs you're weighing.
- On one hand (the benefits): How much faster could we actually complete projects? How many fewer errors would we make with better tools?
- On the other hand (the risks): What’s the total cost, factoring in training time and lost productivity during the transition? How long until we’re back up to speed?
Suddenly, you have a practical list of things to measure. Instead of wrestling with a fuzzy concept like "efficiency," you're now looking for tangible data points like average project completion time, the rate of rework or errors, and the number of hours spent in training.
These are the metrics that will directly reduce your uncertainty and give you the confidence to make the right call. To formalize this process, using a decision making framework template can provide the structure you need to define your measurement goals and avoid getting lost in the data.
By forcing yourself to articulate the decision first, you filter out irrelevant metrics and focus only on the data that can change your course of action. It turns the daunting task of "how to measure anything" into a manageable exercise in targeted information gathering.
When you hear "data collection," what comes to mind? For most of us, it's a vision of massive surveys, eye-watering budgets, and spreadsheets that scroll on forever. We’ve been conditioned to think that to measure something right, you need a mountain of information.
Frankly, that's not just intimidating—it’s usually wrong.
You can get incredibly useful data and slash your uncertainty with surprisingly small, targeted samples. It’s about working smarter, not harder, to get the answers you need to make a confident call without derailing your week for a full-blown research project.
Why a Little Data Goes a Long Way
Think about it this way: when you're completely in the dark about a number, even a tiny bit of information is a huge help. Your biggest "aha" moments—the largest reductions in uncertainty—come from the very first few pieces of data you collect.
This is a lifesaver. It means you can often skip the large, time-consuming datasets, especially when you're just starting to define a problem. The goal isn't perfect precision; it's gathering just enough insight to move forward with more confidence than you had before.
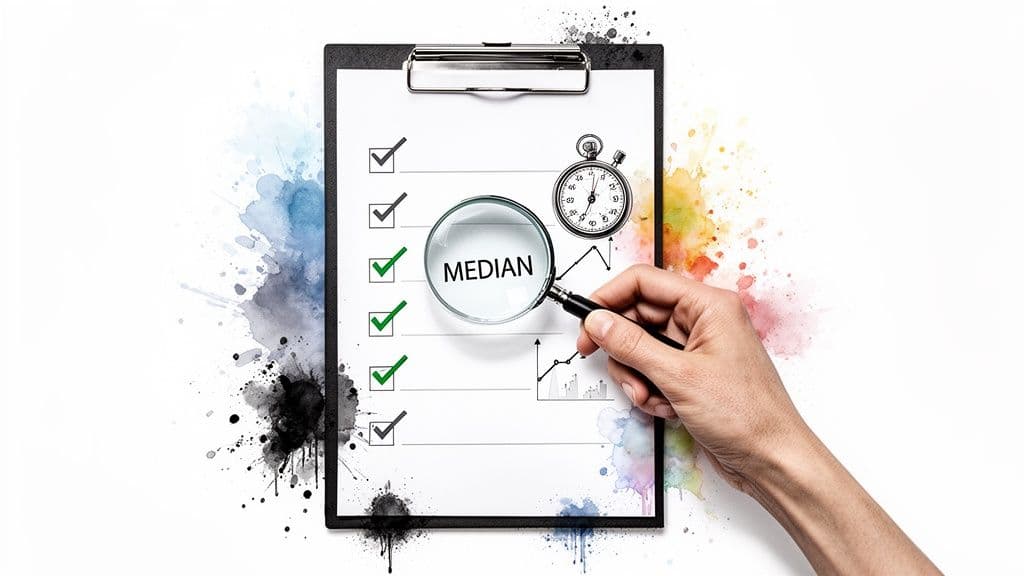
A Practical Shortcut: The Rule of Five
One of my favorite statistical shortcuts, and one that I’ve seen work wonders for teams, is the Rule of Five. It’s a beautifully simple idea for getting a quick handle on a typical value (the median) in any population.
The concept, pulled from the classic book How to Measure Anything, is this: if you take a random sample of five items from a population, there's a 93.75% probability that the true median of the entire population lies between the smallest and largest values in your sample. For more insights like this, I highly recommend checking out this excellent summary of the book's concepts.
The Rule of Five proves that you don't need a massive dataset to create a useful boundary for your problem. With just five random data points, you can establish a surprisingly reliable range for the median value with over 93% confidence.
This isn't about finding an exact number. It's about creating a highly probable range, which is often all you need to make a much better decision.
Putting the Rule of Five into Practice
Let's walk through a real-world scenario. You're a manager, and you have a nagging feeling that the team's weekly status meetings are running long.
Instead of meticulously tracking every meeting for the next quarter, you can use the Rule of Five.
- First, grab a random sample. Pull the times for five recent meetings. Make sure it's random—don't just pick the ones you remember as being painfully long.
- Next, find the durations. Let's say your data points are 45, 55, 62, 75, and 90 minutes.
- Then, find your range. The lowest value is 45 minutes, and the highest is 90 minutes.
That’s it. You can now be 93.75% certain that the true median meeting duration is somewhere between 45 and 90 minutes. You've gone from a vague hunch ("meetings feel long") to a quantified range. If your goal is to keep meetings under 45 minutes, you now have solid evidence showing you're off the mark.
Here’s how a marketing manager could apply the same logic:
- The Decision: Is our content marketing actually working?
- The Uncertainty: I have no idea what our typical blog post engagement rate is.
- The Action: Randomly select five blog posts from the last year.
- The Data: You find the engagement rates are 1.2%, 2.5%, 3.1%, 4.0%, and 5.8%.
With that tiny bit of effort, you're now 93.75% sure the median engagement rate for all your content is between 1.2% and 5.8%. You instantly have a data-backed range to inform your strategy. Is that range good enough, or do you need to rethink your approach? It’s a fast, low-cost way to get a solid answer.
Choosing the Right Measurement Instrument
Alright, you’ve defined the decision you need to make and even have some preliminary data. Now for the real question: how are you actually going to measure the thing you care about? This is where many people get stuck, often thinking they need some complicated, expensive tool. In my experience, it's rarely about the fanciest gadget and always about finding the right method for the job.
The tools at your disposal range from simple observation to highly structured experiments. The trick is to match your measurement method to the level of uncertainty you're trying to eliminate.
It’s a constant balancing act. You're always weighing different approaches to get the insight you need without wasting time or money. The goal is to pick an instrument that gives you just enough precision to make a confident decision.
Selecting Your Measurement Method
When choosing how to measure something, you're always juggling three factors: cost, accuracy, and effort. A hyper-accurate measurement might be too expensive for the decision at hand. On the flip side, a cheap and easy method might not reduce your uncertainty enough to be worthwhile.
Here are a few common approaches I see used effectively:
- Proxies: Sometimes the thing you want to measure is just too fuzzy to grab directly. Think "brand perception" or "product quality." Instead of chasing the abstract, you find a concrete proxy that’s closely related. To gauge product quality, for instance, you could track the number of customer support tickets or the rate of product returns. These are real numbers that tell a story.
- Direct Observation: This is as simple as it sounds. Want to know how long a process takes? Get out a stopwatch and time it. Need to know how many people showed up to your webinar? Count them. It's wonderfully straightforward but can be incredibly manual.
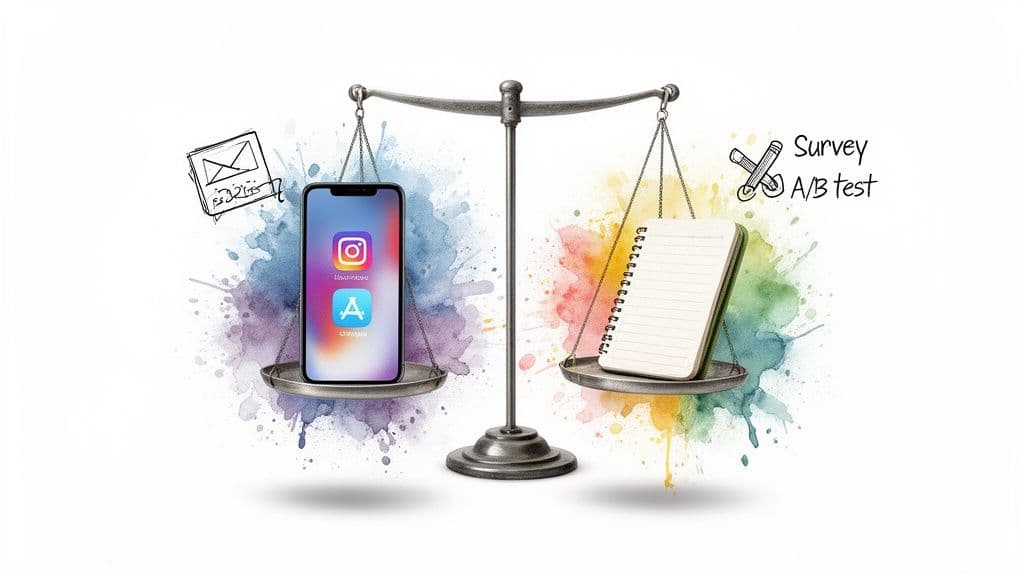
- Surveys: When you absolutely need to know what people are thinking, feeling, or self-reporting, nothing beats a good survey. An eNPS (employee Net Promoter Score) survey, for example, is a classic instrument for getting a pulse on team morale.
- A/B Testing: For comparing two options, this is the gold standard. Marketers live by A/B tests to find winning headlines, just as product teams use them to validate new features. It’s a beautifully controlled way to measure the direct impact of a single change.
Ultimately, picking the right instrument comes down to foundational principles. If you're quantifying a physical warehouse layout, you'd apply fundamental geometric measurements like perimeter, area, and volume. The logic is identical here: pick the tool that actually answers your question.
Leveraging Modern Tools for Automation
Let’s be honest, manually collecting data is a soul-crushing bottleneck. Fortunately, modern software can act as a powerful measurement instrument, automating much of this work behind the scenes.
Think about tracking how long tasks take. You could ask your team to fill out timesheets, but we all know how inaccurate that can be. A far better way is to use a project management tool that automatically logs when tasks are started and completed. Suddenly, you have a stream of accurate data on cycle times, success rates, and team workload without any extra effort.
The most powerful measurement tool is often the one that’s already built into your daily workflow. When your tools capture data automatically, you get a much more honest picture of what’s really happening without the friction of manual tracking.
Here at Fluidwave, we see our users do this all the time, turning the platform itself into their go-to measurement tool. The system automatically tracks everything from task completion rates to delegation success and project timelines. This data isn’t just for a fancy report; it directly fuels smarter decisions about where to allocate resources and how to refine workflows. If you want to dive deeper into this, check out our guide on how to measure operational efficiency.
This strategy even extends to how you delegate. Instead of just offloading work, you can task a skilled virtual assistant with data collection, running basic surveys, or performing the initial analysis. This frees you up for the high-impact work of interpreting the results and making the call. In a way, strategic delegation becomes a measurement tool in its own right.
How to Analyze and Act on Your Findings with Confidence
Collecting data is just the first mile of the marathon. The real finish line is where you translate those numbers into a smart, confident decision. It's a step that trips a lot of people up, but you don't need a Ph.D. in statistics to pull it off.
Think of it this way: before you started measuring, you had a hunch. A theory. Now you have evidence. The goal is simply to use that evidence to sharpen your perspective and reduce your uncertainty. You’re trading a gut feeling for an informed opinion.
Trusting the Data Over Your Gut
Here’s the part where many leaders get stuck. It’s hard to trust a spreadsheet when it contradicts years of intuition. But as powerful as our gut feelings are, they’re shockingly unreliable for navigating complex business problems.
The evidence on this is staggering. In a landmark meta-study by Paul Meehl analyzing 150 comparisons, simple statistical models beat human experts in 144 of those cases. That’s a 96% win rate for the algorithm. Later reviews by Philip Tetlock confirmed it's almost impossible to find a field where human judgment consistently outperforms a basic quantitative model. You can dive into the research yourself over at INFORMS.
The takeaway for anyone in business is clear: lean on the numbers. Even a simple model fed by your measurements gives you a far more reliable foundation than a gut feeling ever will.
When Is It Worth Measuring More?
Before you sink more time and money into collecting even more data, pause and ask yourself if it’s truly necessary. This is where a quick mental exercise, often called calculating the "value of information," can save you a lot of trouble.
It boils down to two simple questions:
- What's the cost of being wrong? What's the real-world downside—in money, time, or opportunity—if you make the wrong call?
- How much will new data reduce my chances of being wrong? Will another round of measurement actually make you significantly more confident?
If the stakes are high and your uncertainty is still clouding your judgment, then yes, go gather more data. For most everyday decisions, however, that first batch of information is often more than enough to get you moving in the right direction.
Your goal isn't to eliminate every shred of doubt. It's to gather just enough insight to get you over the decision threshold and act with confidence.
From Analysis to Action: A Real-World Example
Let's put a bow on this. Imagine you’re a sales manager who just ran a pilot for a new training program. You’re hoping it will increase your team’s average deal size.
- The Decision: Do we roll this expensive training out to the entire department?
- The Measurement: You tracked the average deal size for a small group of reps who went through the training. After one quarter, you found their average deal size jumped by 18%.
- The Analysis: Now, you run the numbers. The training costs $2,000 per rep. That 18% increase in deal size, however, translates to an extra $5,000 in revenue per rep, each quarter.
Suddenly, the choice is obvious. The return on investment is clear, and you can confidently approve the rollout. Without measurement, you'd be stuck debating whether the training felt effective. With it, you have a solid, data-backed answer.
This is what it means to close the loop—to turn observations into real business outcomes. Whether you're managing projects or building a company, this analytical muscle is what empowers you to stop guessing and start acting.
If you’re looking for more ways to turn data into action, you might find our guide on essential project tracking metrics helpful.
Common Questions (and Straight Answers) on Measurement
Okay, so you've got the framework. But I know what you might be thinking, because I’ve heard these questions come up time and time again. It's one thing to talk about measurement in theory, but it's another to apply it to the messy reality of a packed workday.
Let's tackle some of the most common hurdles people face when they start trying to measure what truly matters. My goal here is to give you the straightforward, practical answers you need to move forward with confidence.
What if Something Is Truly Unmeasurable, Like Creativity?
This is the classic objection, and I get it. How can you possibly put a number on something as abstract as a creative spark?
The secret is to stop trying. You don't measure "creativity" directly. Instead, you measure its impact. If your team's creativity is actually improving things, that improvement has to show up somewhere. You just have to figure out where to look.
Ask yourself: "If we were more creative, what would we see changing?" The answers might be things like:
- A higher number of new product features proposed by the team each quarter.
- A better percentage of client pitches won when using a novel concept.
- A measurable reduction in the time it takes to solve a complex, non-standard problem.
See? You're not scoring the idea itself. You're tracking the concrete results that your creative efforts are producing. This approach reduces your uncertainty and tells you if your "creative initiatives" are actually paying off.
How Much Data Is Actually Enough?
The fear of drowning in data is real, and it’s why concepts like the "Rule of Five" are so liberating. You almost always need far less data than you think, especially when you're just starting out. The key is to think in terms of the "Expected Value of Information" (EVI).
It sounds complex, but it boils down to two simple questions:
- How much is this decision worth to my business?
- How uncertain am I about the right answer?
If you’re facing a high-stakes, multi-million dollar decision with a ton of unknowns, then sure, a deep dive into data makes sense. But for the vast majority of our daily and weekly choices, a small, targeted sample is more than enough to shed light on the best path forward.
The goal isn't absolute certainty; it's clarity. You just need enough information to make a better decision than you could have without it. Start small. If the cost of being wrong is still uncomfortably high after that, then you can commit to gathering more data.
How Can I Apply This to My Own Productivity?
This is where the framework really shines for personal growth. The first step is to pinpoint your biggest productivity uncertainty. What’s the one thing that, if you just knew the answer, would fundamentally change how you work?
A perfect example I see all the time is delegation.
- The Decision: "Should I delegate more of my routine tasks?"
- The Uncertainty: "Is the time and money I spend on delegation actually paying off?"
- The Measurement: For the next three to five tasks you delegate, track them in a simple spreadsheet or app. For each one, note the direct cost (like a virtual assistant's fee), the time it would have taken you, and the value of what you did with that reclaimed time (like spending an extra hour on a high-value client project).
After just a handful of examples, you'll have a data-backed answer. You’ll know if delegation is a smart move for you, instead of just guessing.
How Do I Get My Team to Buy Into This?
If you're getting pushback on measurement, it almost always comes from one place: fear. People are afraid of being judged, micromanaged, or having their performance weaponized against them. To get buy-in, you have to completely reframe the purpose of the exercise.
First, make it crystal clear that you're measuring processes, not people. Don't say you're "measuring developer productivity." Frame it as "measuring our bug-fix lead time to find bottlenecks in the workflow." This shifts the focus from individual judgment to collective improvement.
Then, be radically transparent. Share the data openly and involve the team in figuring out what it means. Ask for their insights. When people see that measurement is a tool to remove obstacles and help everyone win, that resistance melts away. It becomes a collaborative game the whole team can play together, not a top-down mandate to perform.
Ready to stop guessing and start making decisions with clarity? With Fluidwave, you can easily track tasks, delegate work to skilled assistants, and automatically gather the data you need to measure what truly matters. Take control of your workflow and find your focus.
Discover how Fluidwave can transform your productivity today.
Focus on What Matters.
Experience lightning-fast task management with AI-powered workflows. Our automation helps busy professionals save 4+ hours weekly.