Master Visio process mapping with this practical guide. Learn to build swimlanes, use stencils, validate flows, and share diagrams your team will actually use.
July 25, 2026 (Today)
Visio Process Mapping: A Practical Step-by-Step Guide
Master Visio process mapping with this practical guide. Learn to build swimlanes, use stencils, validate flows, and share diagrams your team will actually use.
← Back to blog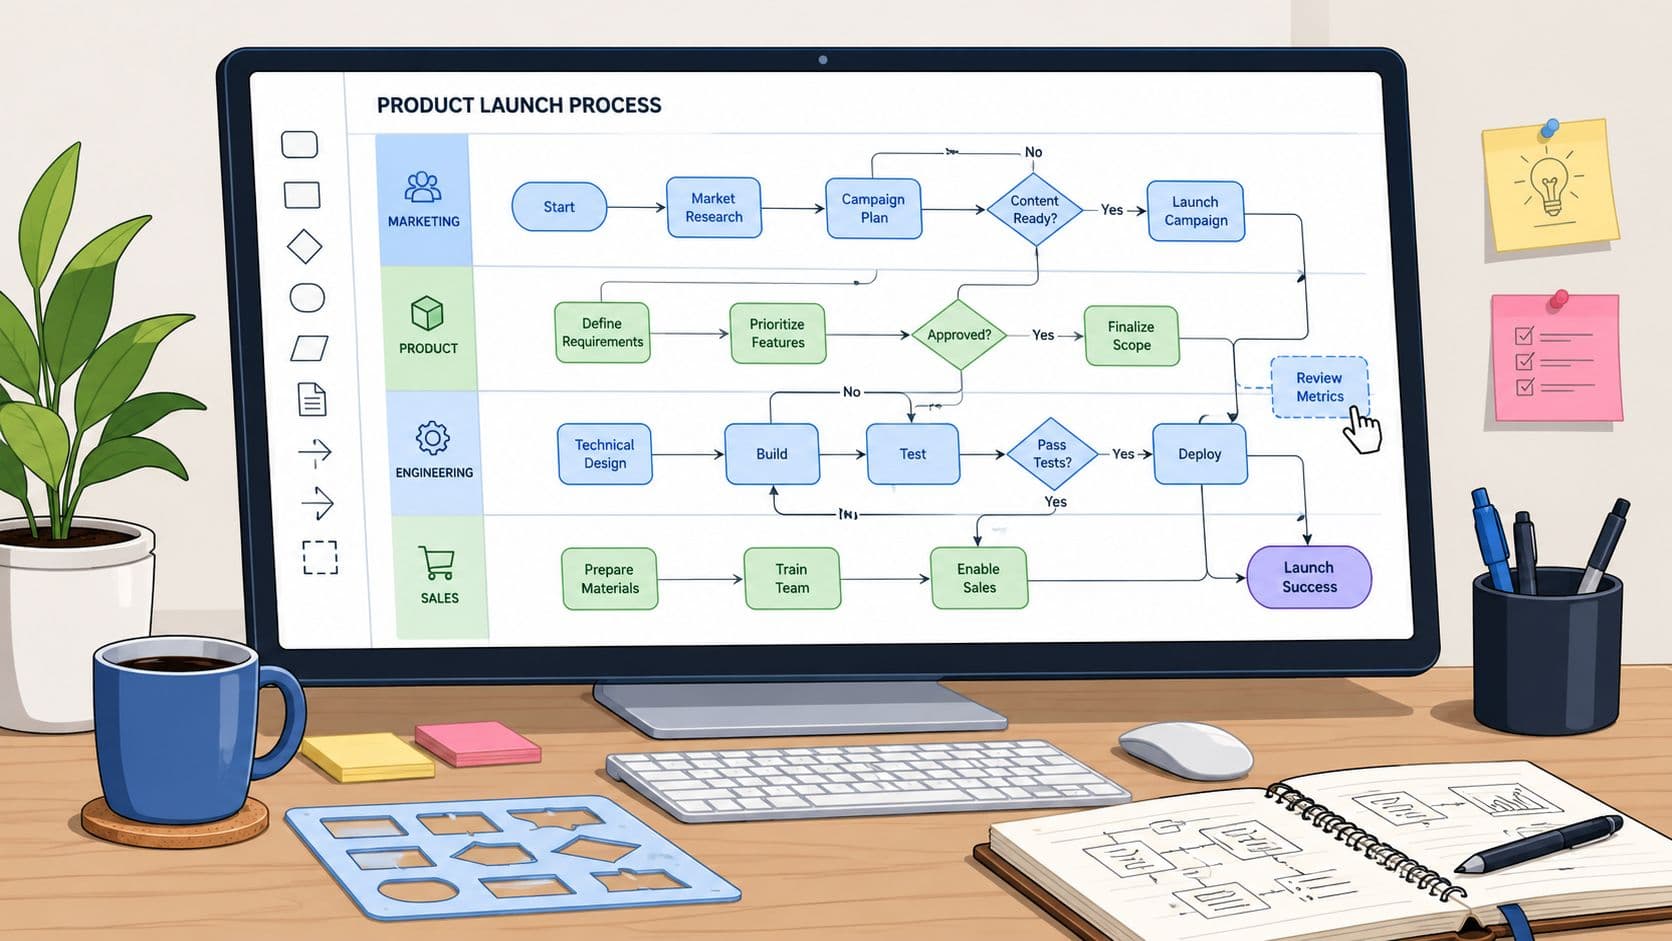
Teams don't fail at Visio process mapping because they picked the wrong symbol. They fail because they treated the map like a one-time drawing, then wondered why nobody trusted it a week later. The file looks clean, the arrows line up, and the meeting ends with nods. Then the first exception appears, someone spots a missing handoff, and the whole thing starts to look like a polished guess.
That's the trap. Visio process mapping works when it behaves like a model with ownership, metadata, and a maintenance path, not a poster. Microsoft's own Visio guidance makes that possible by supporting both blank-start diagrams and data-driven imports, so the map can be built as a reusable process artifact instead of a static sketch (Microsoft Visio process diagrams guidance). If you want the practical version of that mindset, a good external reference on the broader automation side is Automation design and engineering from Refact, especially for teams that eventually want the map to feed operational work rather than sit in a folder.
Why Most Visio Process Maps Stop Working After the First Week
The collapse usually starts in a familiar way. An operations lead finally gets a quiet afternoon, opens Visio, and builds a clean-looking map of a recurring workflow. The team agrees it captures the main steps, everyone says it is helpful, and the file gets saved in a shared folder. By the next week, the only person who opens it is the person who made it.
That happens because the map described the process the team thought they had, not the one they really run. It also usually lacks the fields that make a diagram reusable, like step IDs, owners, next-step logic, and a way to track changes over time. Without those, the file cannot be sorted, compared, regenerated, or tied back to a real operating rhythm.
Drawing is easy, modeling is the hard part
A static Visio file answers one narrow question, what does the flow look like today? A useful process map answers harder questions too, who owns each step, where does work branch, what changes when the policy shifts, and which steps keep coming back in reviews? That is why visio process mapping needs the same discipline as any other operating model.
Practical rule: if a map cannot be checked against the people who do the work, it is decoration, not documentation.
The difference matters in cross-functional environments. Visio is useful because it gives teams a common process-diagram format, which matters when handoffs need to survive beyond one meeting. If you want the map to support operations, it needs enough structure to outlive the first draft. That means owning the boundary, naming the process clearly, and deciding what should be captured as data, not just what should be drawn as boxes.
A better benchmark is simple. If a reviewer cannot use the map to challenge a step, compare a path, or spot a missing handoff, the map is not finished yet. It is just visually tidy. For teams that eventually want the diagram to feed operational work instead of sitting in a folder, Automation design and engineering is the kind of partner reference that fits that mindset.
Setting Up the Mapping Project Before You Open Visio
A process map goes wrong before the first shape appears when the team starts with the canvas instead of the problem. The first decision is whether you are documenting the as-is state or designing the to-be state. Mixing those two in one file creates confusion fast, because reviewers cannot tell whether they are validating current work or debating a future model. A good scope statement stays to one sentence and names the start point, the end point, and the boundary of the team or system you are mapping.
Then identify the people who can push back on the draft. You need a process owner, plus the SMEs who know where the work stalls, loops, or gets rerouted in real life. Without that challenge, the map usually skips the ugly middle, and that is where most operational pain sits.
Pick the right starting template
The first choice should match the audience, not personal preference. A process can start from a new blank drawing, and the Shapes pane lets you search for terms like audit or bpmn before choosing a template or stencil. That flexibility matters because Visio process mapping is a modeling task, not a drawing exercise, and the template should fit how the map will be used.
- Basic Flowchart: use this when the audience mainly wants a straightforward step sequence.
- Cross-Functional Flowchart: use this when role ownership or handoffs matter, because swimlanes make responsibility visible. For a practical walkthrough of lane setup, see swimlanes in Visio.
- BPMN template: use this when the organization expects formal process notation or more explicit handoff logic.
If the process is broad, start with a single page anyway. That constraint forces a decision about what belongs in the core flow and what belongs in a subprocess page. A map that tries to cover everything on day one usually becomes too wide to print and too messy to review.
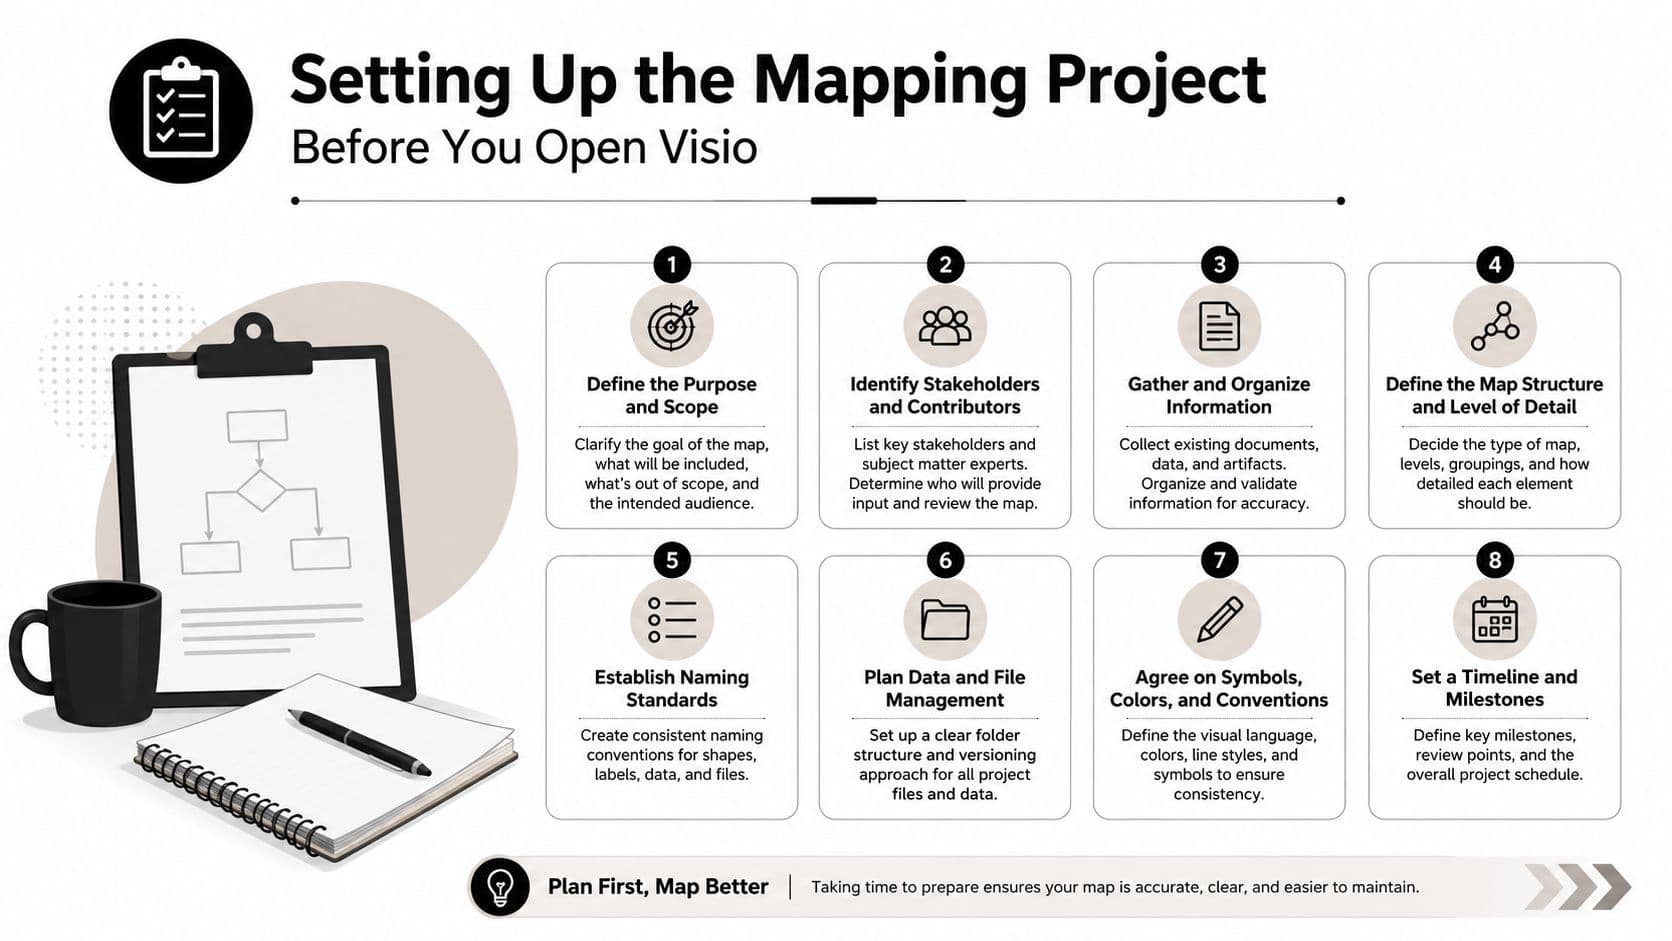
Before you draw, build a title block. Include the process name, author, revision date, division or department, and process owner, plus a short note on the level of detail you are using. A beginner-friendly Visio walkthrough recommends those title-page elements, and they make the file easier to find later (Visio title-page guidance).
The discipline feels dull, but it pays off. A file that starts with a clear scope and title block is easier to maintain, easier to review, and easier to trust when the process changes.
Building the Diagram with Swimlanes and Standard Symbols
A cross-functional Visio map works best when the work runs in time order and each lane shows who owns the step. Horizontal swimlanes usually fit that pattern because the flow reads left to right and the handoffs stay visible. Visio also supports starting from a blank drawing and choosing the template or stencil that fits the job, rather than forcing every process into one diagram type.
Begin with the start shape, then place the next activity to the right. Use rectangles for activities, diamonds for decisions, and a clear end shape when the work leaves the process. The goal is not symbol collection. The goal is a path that another analyst can follow without asking for a walkthrough.
Keep the lanes readable
Strong maps stay disciplined. Each shape belongs in the correct swimlane, and each connector should move in one direction so the eye does not have to hunt for the next step. That is the reason lane labels, alignment, and spacing matter, especially when the diagram needs to survive a screen review and a printed review.
Keep the connector logic boring. Boring diagrams are easier to audit.
I usually check the page boundary after a few shapes instead of waiting until the end. If an object drifts outside the printable area, the canvas expands and the file becomes harder to print cleanly. That small slip creates extra work later, because a map that exports poorly to PDF often gets ignored in meetings.
Break density before the page breaks you
When the process starts to crowd the page, stop stretching the canvas. Move the detail into a subprocess page and link it from the main map instead. That keeps the primary diagram readable and gives approvals, exceptions, or downstream tasks a place to live without forcing every detail onto one screen.
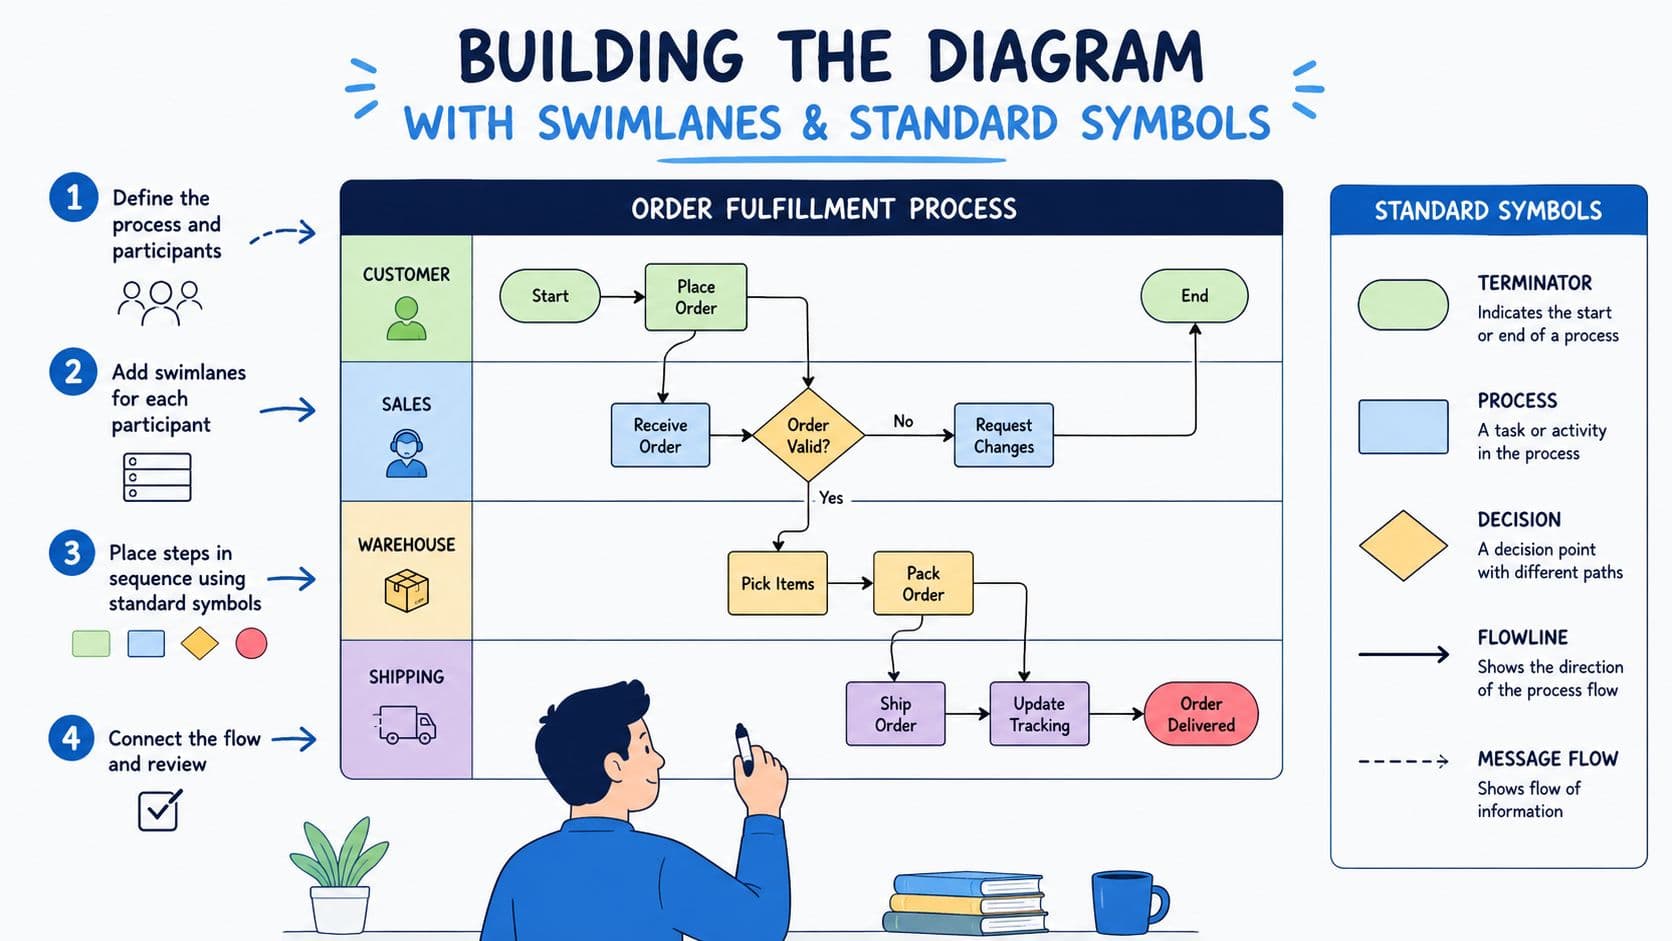
A practical reference for lane structure and layout is swimlanes in Visio. Use it when role boundaries matter more than the symbols themselves.
The final check is visual. If someone cannot tell who owns the step, what triggers it, and what happens next in under a minute, tighten the layout.
Adding the Metadata That Makes a Map Reusable
This is the part most tutorials skip, and it's the part that changes everything. A map with only boxes and arrows is hard to reuse. A map with step IDs, owners, cycle-time estimates, and next-step links can be analyzed, compared, and regenerated when the process changes.
Think of every shape as a record, not just a graphic. The canonical version of the process should live as a table, where each row represents one step and the columns hold the metadata behind the map. That's how newer Visio workflows move from manual redraws toward table-driven process models, including Visio's Data Visualizer-style import path that can recreate the diagram when the source table changes.
| Field | Purpose | Example |
|---|---|---|
| Step ID | Gives each step a stable reference | AP-014 |
| Step name | Describes the action in plain language | Review invoice |
| Owner | Shows who owns the step | Accounts payable team |
| Next step | Defines the path after completion | AP-015 |
| Decision flag | Marks branch points | Yes or No |
| Cycle time | Helps the team understand effort | Reviewed during mapping, not guessed |
| System | Links the step to the tool used | ERP, SharePoint, email |
| Notes | Captures exceptions or context | Escalate if amount is missing |
A practical sizing note helps here. Current practitioner workflows often treat about 20 steps as a quick validation target, and 20-40 steps as a realistic range for a usable Visio Data Visualizer-style process map. That range is large enough to expose handoffs and rework, but still small enough to maintain without turning the file into a mess. The goal isn't to make the diagram feel complete forever. The goal is to make it editable without starting over.
Useful habit: if a field matters to the next review, put it in the row now. If you wait, somebody will recreate it from memory later, and that version will drift.
A strong internal pattern for this kind of structure is described in process documentation example. The important thing is not the template itself, it's the discipline of treating shape data as operating data.
The map becomes reusable when the metadata is consistent. That's what lets a process owner update the table and regenerate the diagram instead of manually nudging ten shapes after every policy change.
Validating the Flow Before You Share It
Validation should feel separate from drawing, because it is. A clean-looking Visio file can still be wrong, incomplete, or impossible to follow. The fastest review is a live walkthrough with the people who run the process, starting from the as-is state and asking them to narrate each step in order.
Begin with the obvious checks. Look for orphan shapes that nobody can explain, dead ends that don't match how the work exits the team, and decision diamonds that don't have a clear labeled branch. Also confirm that the start and end shapes reflect real entry and exit points, not the version someone prefers in theory.
Five minutes that save a revision cycle
- Walk the map out loud: Ask an SME to narrate the flow from the first trigger to the final handoff.
- Check the branches: Every decision should have clear, named paths, and the labels should reflect real outcomes.
- Match the boundary: The diagram should stop where the team's responsibility stops.
- Preview the print layout: A map that won't print well usually won't be used in a meeting.
- Capture edits as comments: Let reviewers note issues without overwriting the canonical file.
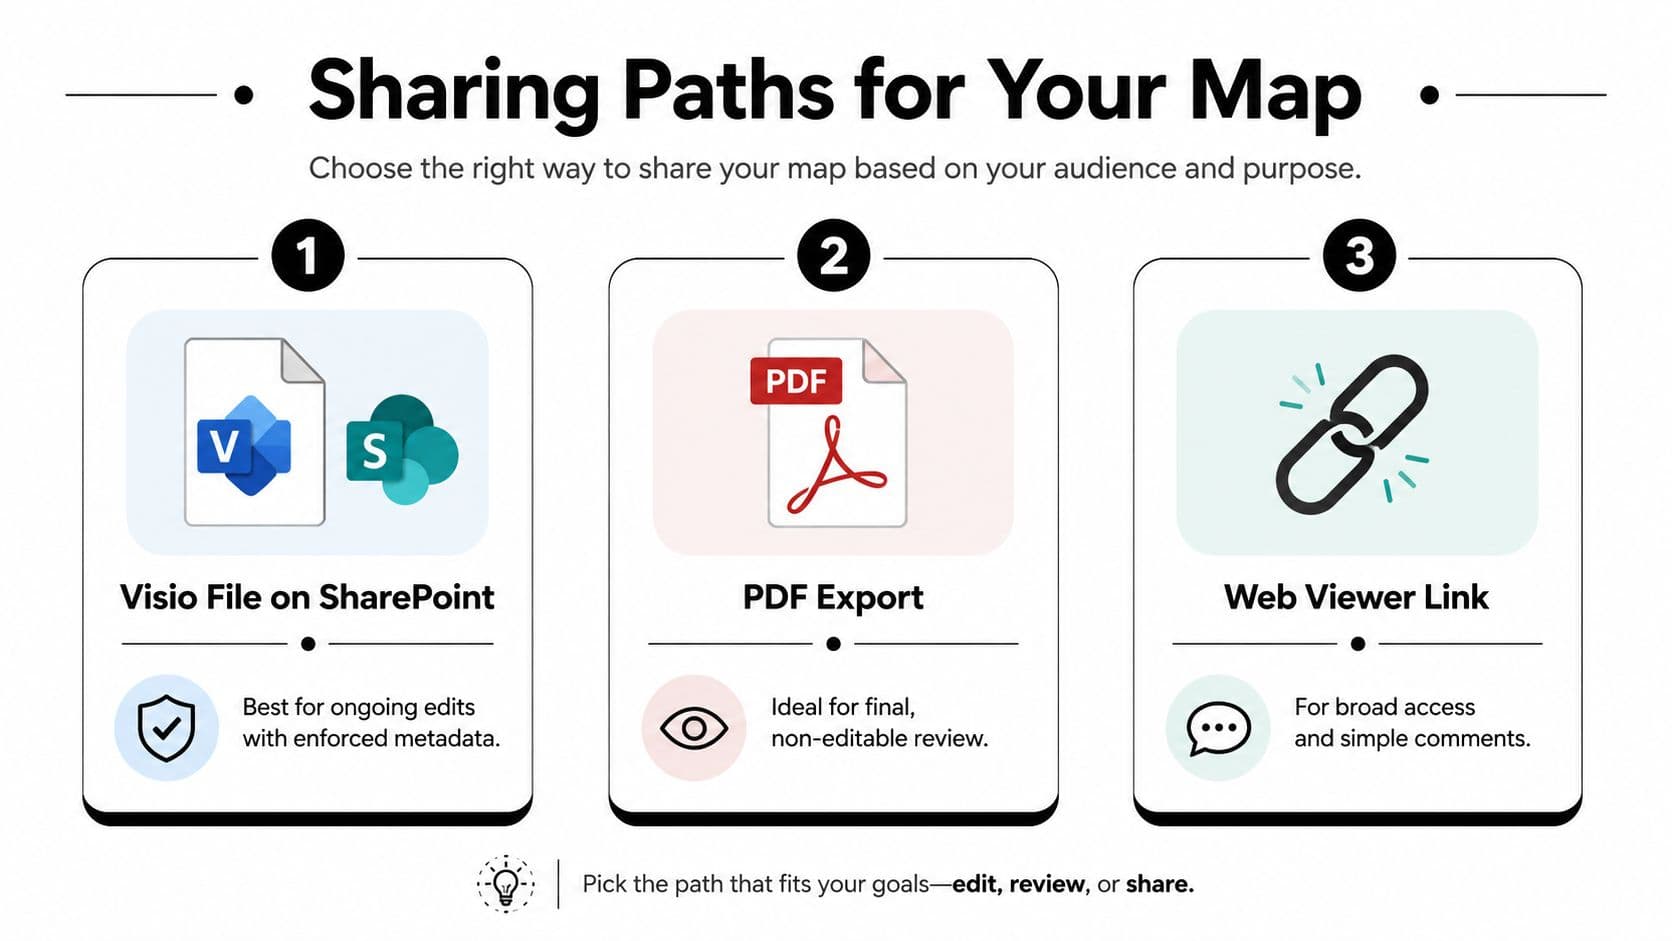
A useful sharing aid for draft review is a simple export path comparison, especially when different audiences need different levels of edit access.
A related internal reference on flowchart cleanup and review patterns is flowcharts process mapping. Use it when you need a second pass on readability and scope.
The main rule is simple. If the reviewer has to fix the map directly, you lose the audit trail. If the reviewer comments on the draft and the owner updates the canonical version, the process stays controlled.
Exporting and Sharing the Map With Your Team
The right sharing format depends on who needs to do what next. A Visio file on SharePoint is the right home when the map will keep changing, because the file can stay tied to a shared location with enforced metadata and versioning. A PDF export fits better when the audience only needs to review, print, or approve the map without editing it.
An embedded image or link inside a SOP or wiki page works well when the map supports a recurring workflow. In that case, the diagram should sit beside the instructions people already use, not float around in an email thread nobody can find later. The maintenance question matters more than the format question.
Choose the home based on edit risk
If people need to revise the map, keep the canonical Visio file in one location and stop circulating attachments. If people only need to read it, export a PDF and freeze the layout. If the process is part of a broader operating procedure, place a link where the work gets done, then keep the file name and title block consistent so the version is obvious.
A shared file also needs a sane naming convention. The filename should make it clear which process, which department, and which revision you're looking at, because that cuts down the scramble when multiple versions are open in parallel. Version notes in the title block help too, especially when the map has gone through a few review cycles.
For teams that need a broader workflow home, Fluidwave can serve as a task and workflow layer alongside documentation, with tasks, priorities, collaboration, and delegation in one place. That doesn't replace Visio, but it can sit next to the process file when teams need a place to act on the map.
The win is consistency. One canonical URL, one editable source, and one printed artifact for review keep the map from fragmenting into competing copies.
Habits That Keep a Process Map Alive Past the First Quarter
Treat the map as a living file, not a project deliverable. Keep one source of truth, assign the owner to the file rather than to the project, and schedule a recurring walkthrough with the SMEs who still run the work. When the process changes, regenerate the diagram from the underlying table instead of hand-editing the shapes until they drift.
The hard part of Visio process mapping isn't learning the symbols. It's keeping the diagram honest after the first revision cycle, and that's where many teams get lazy. The teams that keep using their maps do three things well, they govern the source, they review the flow, and they refuse to let stale versions multiply.
A CTA for Fluidwave to organize the follow-up work around your Visio process map, assign owners, track revisions, and keep the next review from turning into another lost afternoon.
Focus on What Matters.
Experience lightning-fast task management with AI-powered workflows. Our automation helps busy professionals save 4+ hours weekly.