Master the cost variance formula (CV = EV - AC) to control project budgets. Calculate, interpret, and use CV to prevent overruns and improve forecasting.
April 20, 2026 (2mo ago)
Cost Variance Formula: Master Budget Control
Master the cost variance formula (CV = EV - AC) to control project budgets. Calculate, interpret, and use CV to prevent overruns and improve forecasting.
← Back to blog
You know the feeling. The team is moving, tasks are getting checked off, status updates sound healthy, and nobody’s panicking. Then an invoice lands, or payroll closes, or a contractor sends a revised bill, and suddenly the budget doesn’t match the progress you thought you had.
That’s the moment many project leads realize they’ve been tracking activity, not value.
A project can look busy and still be drifting financially. Designers are designing. Developers are shipping. Operations is approving things. But if the cost of the work completed is outpacing the value of the work completed, the project is already in trouble. By the time that shows up in a budget review, your options are narrower. You’re no longer steering. You’re correcting.
The cost variance formula helps you catch that earlier. It gives you a simple way to compare what the completed work should have cost against what was spent. Used well, it becomes less of an accounting metric and more of a manager’s early warning light.
That Sinking Feeling When a Project Goes Over Budget
A product lead I worked with once had a launch that looked healthy from the outside. The roadmap was moving. The team had closed a stack of tickets. Stakeholders saw progress in weekly demos and assumed everything was fine.
Then the finance review happened.
The problem wasn’t that the team had stopped working hard. The problem was that labor hours, rework, and rushed fixes had piled up faster than the value delivered. The project wasn’t failing in public. It was failing in the background, where most budget problems start.
That’s why budget overruns feel so frustrating. They rarely arrive with a dramatic warning. They creep in through small decisions. A task takes a little longer. A specialist gets pulled in. A vendor change adds cost. A rushed handoff creates rework. On their own, those things don’t look fatal. Together, they can wreck a margin.
Why progress alone can fool you
Many organizations naturally watch visible signals:
- Tasks completed: The board looks active, so people assume the project is healthy.
- Hours logged: A full timesheet can create false confidence.
- Milestones reached: A milestone can be hit while the underlying spend is already off course.
Those are useful signals. They’re just not enough.
If you only track what got done, you can miss whether you paid too much to get there.
That gap is one reason so many initiatives drift. If you’ve seen projects stall despite lots of motion, common causes of project failure often include weak visibility into cost, scope, and execution discipline.
What managers actually need
You need a number that answers a harder question: Is the work completed worth what we’ve spent so far?
That’s what cost variance does. It strips away some of the noise and gives you a clean signal. Are you under budget, over budget, or right where you planned to be?
Once you have that, the conversation changes. You stop saying, “We’re busy.” You start saying, “We’re spending more than the value we’ve earned,” or, equally, “We’re delivering efficiently.”
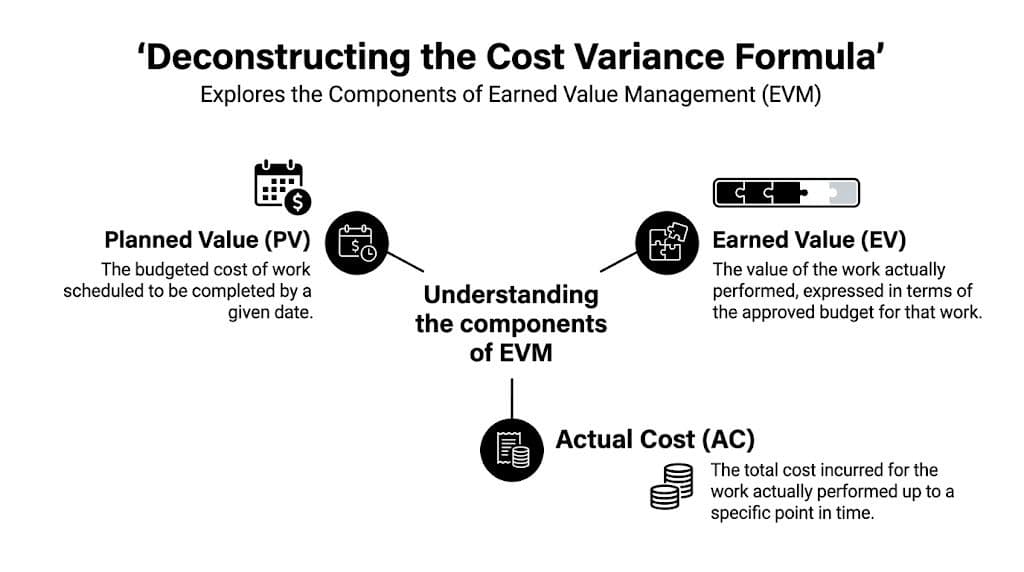
Deconstructing the Cost Variance Formula
A sprint can look productive all week, then the budget review lands with bad news. The backlog moved. Tasks closed. The spend still ran hotter than expected.
The cost variance formula gives you a fast way to check whether the value of completed work matches what you paid to get it.
CV = EV - AC
That formula comes from Earned Value Management, or EVM. It became widely used on complex programs that could not rely on gut feel alone, including early aerospace work, as explained in this overview of cost variance and EVM origins.
The math is short. The meaning behind the letters is what trips people up.
A simple analogy helps clarify them. Say you hire someone to build a custom desk for your office. You agree on a budget and timeline before work starts. As the job moves along, you can look at the project through three different money lenses.
Planned Value
Planned Value, or PV, is how much of the budget should have been used by this point based on the schedule.
If the desk was supposed to be halfway finished by Friday, PV is the budget tied to that planned halfway mark. In an agile sprint, the same idea applies to the work you expected to finish by day five, not the work the team hopes to finish by day ten.
PV matters because it anchors the original plan. It is part of EVM, even though it does not appear directly in the cost variance formula.
Earned Value
Earned Value, or EV, is the budgeted value of the work that is complete.
This is the concept that causes the most confusion. EV is not your invoice total. It is not hours logged. It is the planned budget value of finished work.
If half the desk is complete, EV equals the budgeted value of that half. If a product team finishes 6 out of 10 planned story points for a sprint, EV reflects the budgeted value of those completed points, assuming your team has a reasonable way to translate work into budget value.
That distinction matters on fast-moving teams. In tools like Fluidwave, tasks get reassigned, priorities shift, and specialists jump in to unblock delivery. EV keeps you focused on value completed, even when the path to completion changes mid-sprint.
Actual Cost
Actual Cost, or AC, is what you have really spent so far.
For the desk, that includes labor, materials, hardware, and any contractor charges. For a startup team or agency sprint, AC may include payroll allocation, freelancer time, software usage, and rush work added after priorities changed.
AC is the cash out the door.
Why EV confuses people
EV sits between the plan and the spend, so people often slide it into the wrong bucket.
Use this quick memory aid:
- PV is what you planned to get done by now
- EV is the budgeted value of what is done
- AC is what you spent
Practical rule: EV tells you what the completed work should have cost according to the budget, not what it did cost in real life.
Once that clicks, the formula gets easier to read.
If EV is greater than AC, you delivered more budgeted value than you spent. That is favorable.
If EV is less than AC, the completed work cost more than its budgeted value. That signals overspending, even if the team feels busy and productive.
Calculating Cost Variance in Four Simple Steps
The cost variance formula becomes useful instead of theoretical. You don’t need a finance team to do it. You need a project budget, a realistic progress estimate, and a record of actual spend.
Let’s use one clean example from start to finish.
Step 1 Determine the earned value
Take the Budget at Completion, often called BAC, and multiply it by the actual completion percentage.
Wall Street Prep gives a straightforward example: for a $5,000 project at 50% completion, EV = $2,500 in its explanation of the cost variance formula and CV percentage.
So the logic is:
- Total budget = $5,000
- Actual progress = 50%
- Earned Value = $2,500
This step matters because it forces you to ask what’s done, not what feels close to done.
Step 2 Pull the actual cost
Now gather the actual spend for that same completed work.
In the same example, Actual Cost is $2,750. This should come from time entries, invoices, payroll allocation, contractor bills, or however your team tracks spend.
If your numbers are messy here, the formula won’t save you. Cost variance is only as trustworthy as the underlying project data.
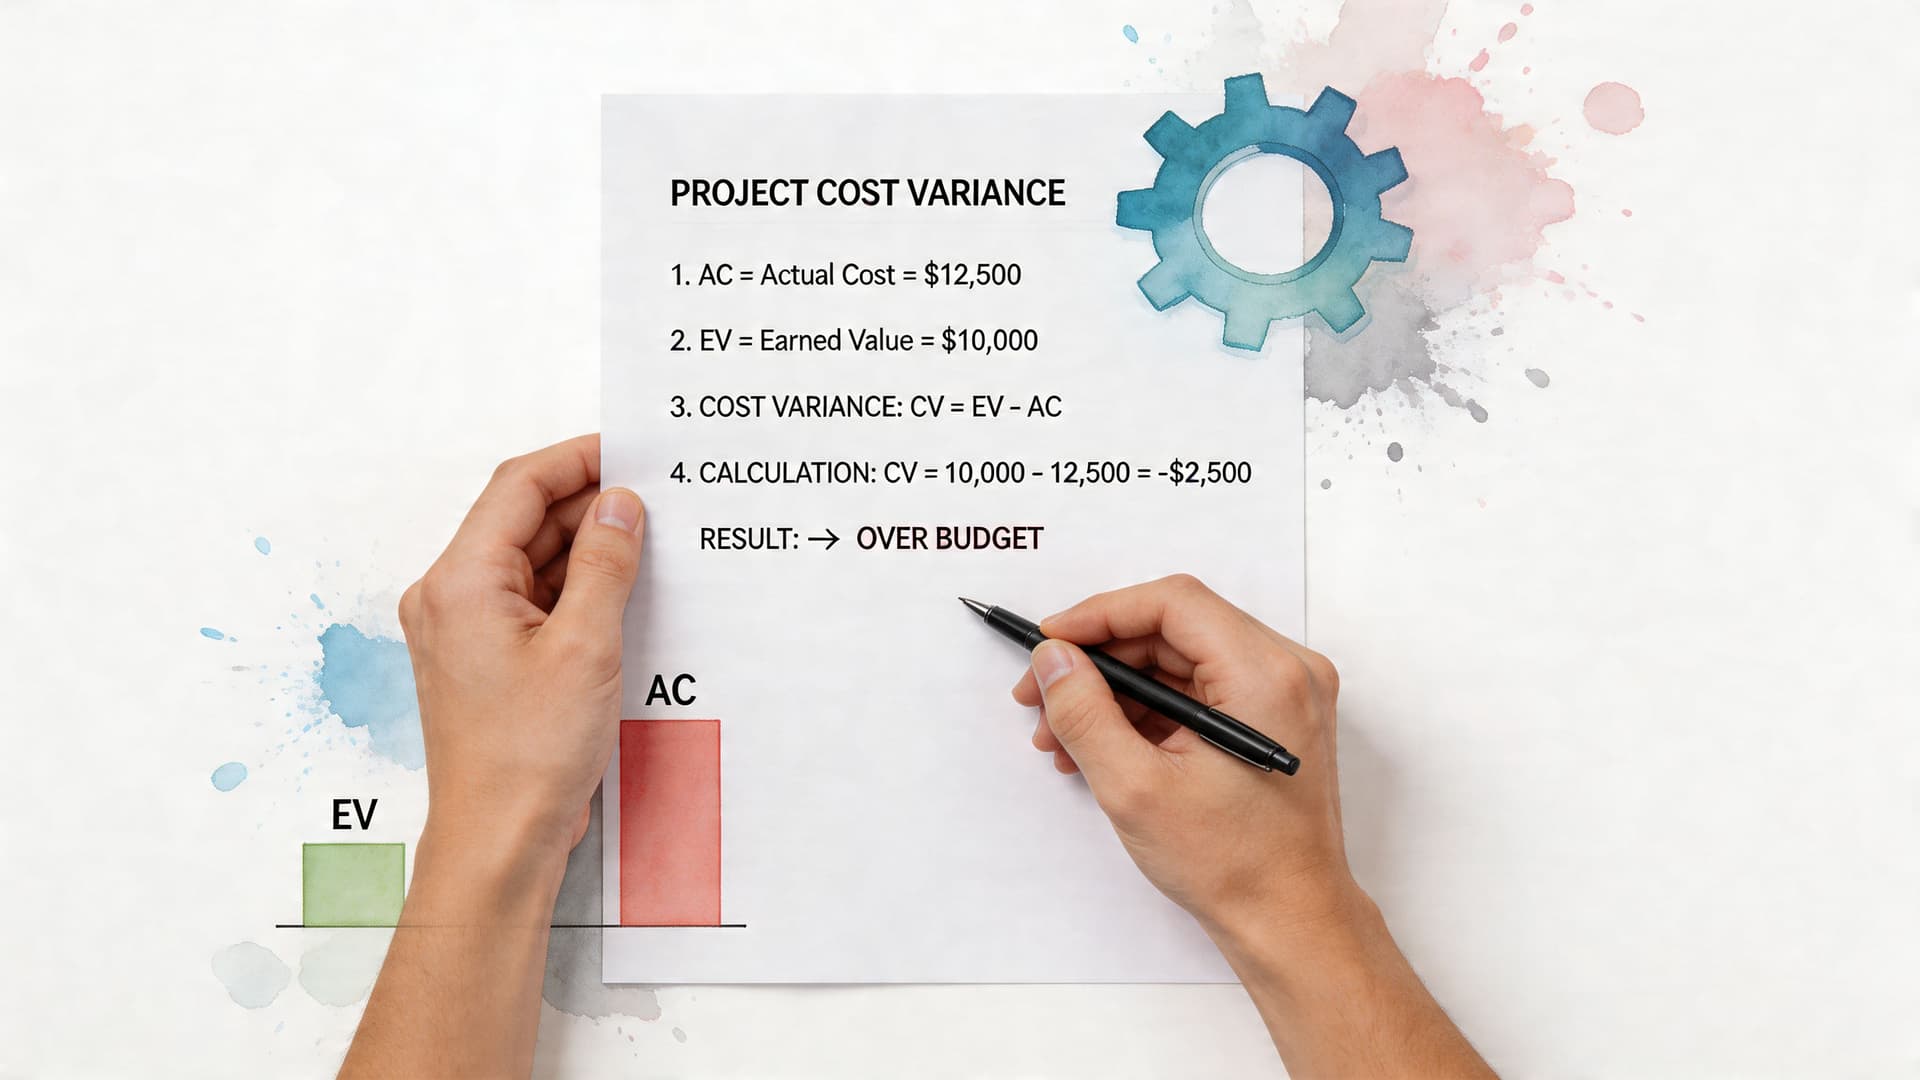
Step 3 Apply the formula
Now subtract Actual Cost from Earned Value.
CV = EV - AC
Using the example:
- EV = $2,500
- AC = $2,750
- CV = -$250
That result means the project has spent $250 more than the value of the work completed.
Here’s a quick reference:
| Item | Value |
|---|---|
| Budget at Completion | $5,000 |
| Completion percentage | 50% |
| Earned Value | $2,500 |
| Actual Cost | $2,750 |
| Cost Variance | -$250 |
Step 4 Convert it into a percentage
Dollar variance is useful. Percentage variance is often better because it gives context.
The same Wall Street Prep example shows the formula for Cost Variance Percentage:
CV% = (CV / EV) × 100
So:
(-$250 / $2,500) × 100 = -10%
That means the completed work is running 10% over its earned value.
A short walkthrough can help cement the math:
Why the percentage matters
A raw dollar number can mislead. A negative variance might be tiny on a large initiative and serious on a small one. CV% helps you compare performance across tasks, sprints, or projects without guessing at materiality.
Don’t stop at the dollar gap. Translate it into a percentage so you can judge whether the issue is minor friction or a real budget problem.
How to Interpret Your Cost Variance Results
A cost variance result is only useful if it changes your next decision. The number itself is simple. The judgment around it takes practice.
AcqNotes gives a practical example with a website redesign. The budget is $10,000, the work is 60% complete, so EV = $6,000. If AC = $7,500, then CV = -$1,500, which translates to -25%. That’s not a mild concern. It’s a sign that the project needs immediate correction, as shown in this website redesign cost variance example.
What the sign of the number tells you
At a basic level, there are only three outcomes:
- Negative CV: You’ve spent more than the earned value of the work completed.
- Positive CV: You’ve spent less than the earned value of the work completed.
- Zero CV: Spending aligns exactly with earned value.
That sounds obvious, but interpretation gets more interesting when you add context.
A positive variance isn’t always a victory. Sometimes it reflects genuine efficiency. Sometimes it means work quality is weak, scope was reduced, or a team pushed costs into a later period. A negative variance isn’t always a disaster either. Sometimes it’s a temporary spike caused by front-loaded setup costs.
Read the trend, not just the snapshot
One negative month may be noise. Repeated negative results usually aren’t.
If your CV keeps moving further below zero, your project manager brain should shift from “monitor” to “diagnose.” Look for scope changes, low productivity, rushed approvals, expensive resources, or hidden rework.
If you’re building a stronger review rhythm, these project tracking metrics help place cost variance beside other signals instead of treating it as a standalone number.
A single bad variance deserves attention. A worsening pattern deserves intervention.
Pair CV with CPI
Cost variance is easier to interpret when you view it alongside Cost Performance Index, or CPI. CPI is EV / AC.
| CV Value | CPI Value | What It Means | Action Required |
|---|---|---|---|
| Negative | Less than 1 | Work is costing more than the value earned | Investigate causes and correct quickly |
| Zero | Equal to 1 | Spending matches earned value | Maintain controls and keep watching |
| Positive | Greater than 1 | Work is being delivered under budget | Confirm quality and repeat what’s working |
Use thresholds without becoming robotic
Many teams define thresholds that trigger a review. The exact threshold depends on the work, risk tolerance, and margins involved. What matters is consistency. Set a point where someone must ask, “Why did this happen, and what do we do next?”
Without that discipline, cost variance becomes a reporting exercise. With it, the formula becomes a management habit.
Advanced Analysis for Deeper Project Insights
Once you’re comfortable with the basic cost variance formula, the next leap is learning where the variance lives. That’s where many teams improve their decisions. They stop treating the budget problem as one big lump and start isolating the exact interval where things changed.
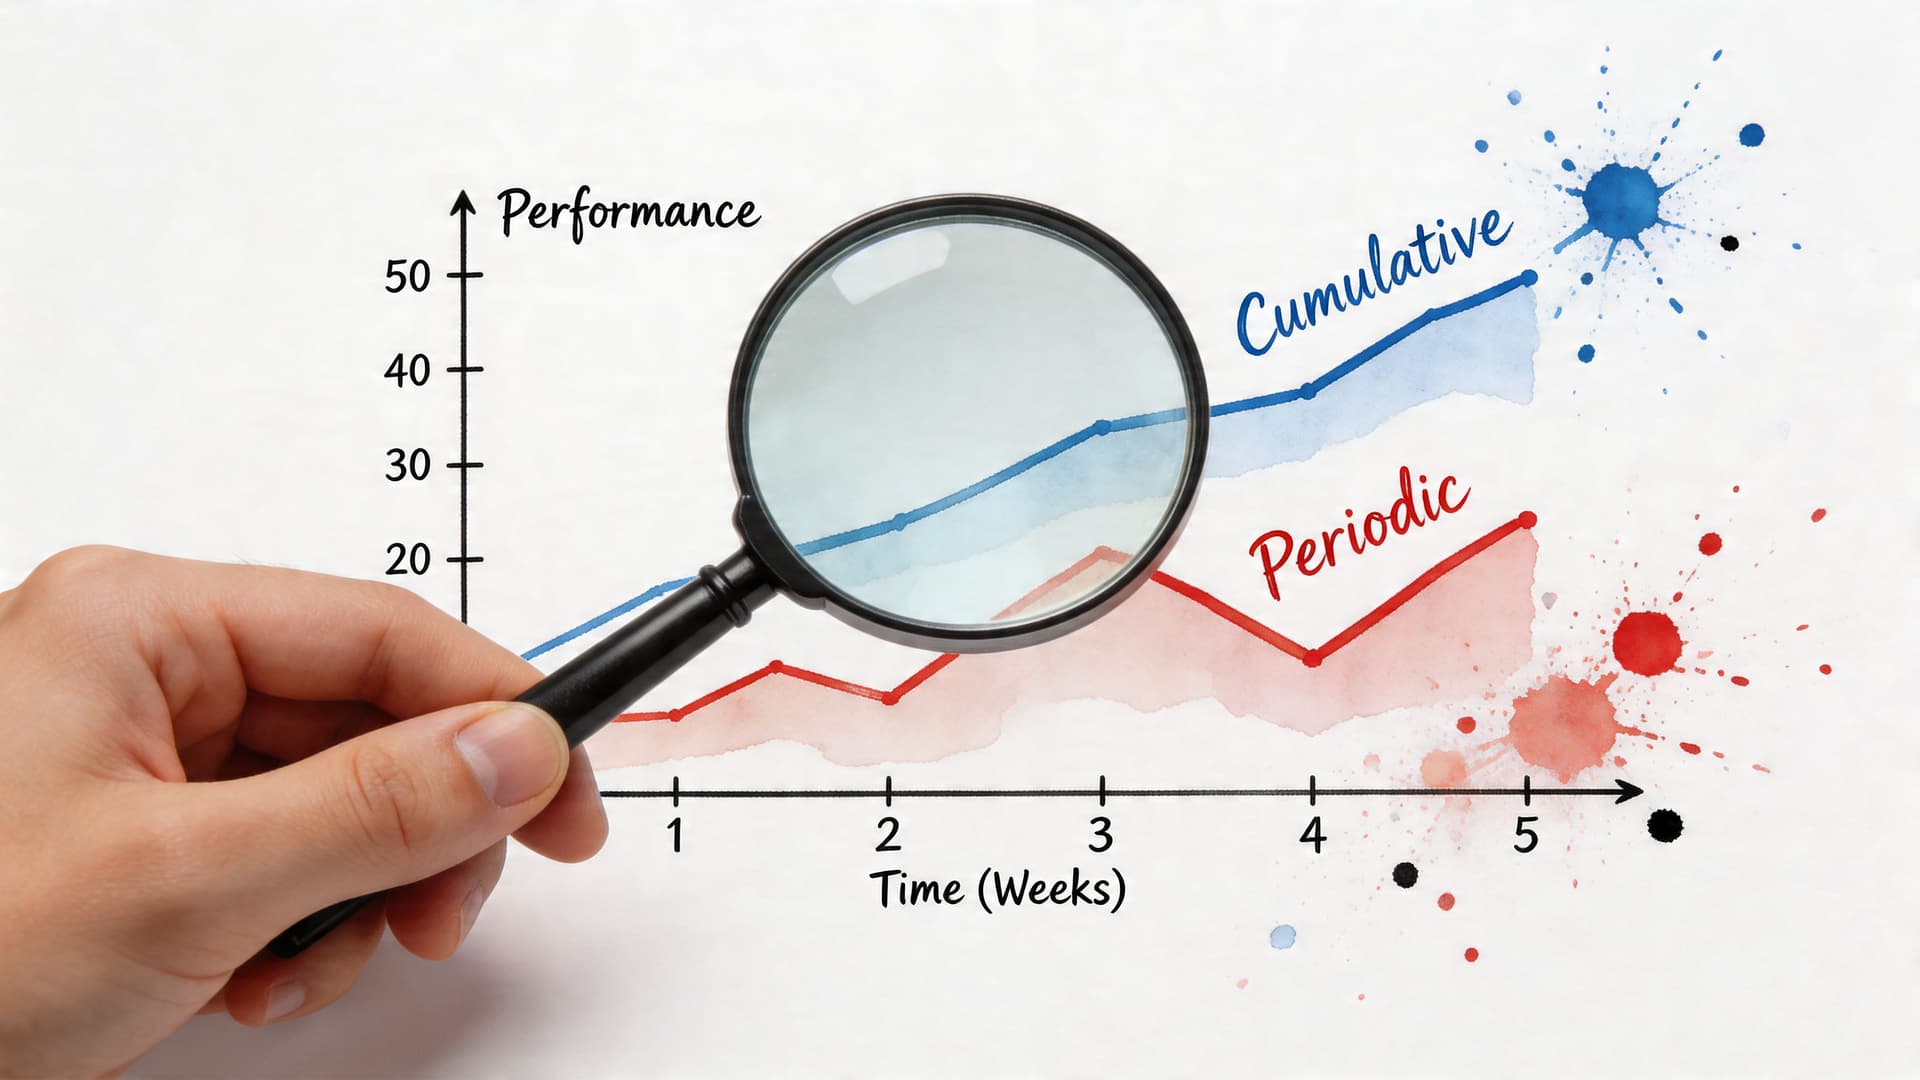
Cumulative versus period by period
Project Management Academy draws a useful distinction between Point-in-Time Cost Variance and Cumulative Cost Variance in its discussion of cost variance formula decomposition.
- Point-in-Time CV: Looks at a single week or month using CV = EV_period - AC_period
- Cumulative CV: Looks at total project performance to date using EV_total - AC_total
That same source notes that firms using this kind of decomposition reduce budget overruns by 35% through root-cause interventions.
Cumulative numbers can hide turning points. For instance, a project may look broadly acceptable overall while one recent sprint is going badly off course.
Why agile teams should care more than they think
In fast-moving environments, work changes shape quickly. A sprint can look fine at the release level while one expensive task is chewing through budget. That’s why period-by-period analysis fits agile work so well.
For a founder, agency lead, or operations manager, this can be the difference between saying “the quarter went over” and saying “the handoff in sprint three triggered rework, which changed the labor cost profile.”
That’s a much more manageable conversation.
A broader financial lens helps too. If you want to connect project cost variance with planning discipline, forecasting, and actual-versus-expected analysis, this guide to Budget Variance Analysis is a useful companion.
Add neighboring metrics, but keep the goal simple
Cost variance becomes stronger when you pair it with a few nearby metrics:
- Schedule Variance: Tells you whether work is ahead or behind the planned schedule.
- CPI: Shows cost efficiency as a ratio.
- Root-cause categories: Labor, materials, vendor pricing, rework, or scope shifts.
You don’t need a giant dashboard on day one. Start with a question that helps your team act: “Did the variance come from this period, or has the problem been accumulating for weeks?”
If your delivery model depends on balancing workloads across people and tasks, resource allocation in project management becomes especially relevant once your variance numbers start pointing to staffing or sequencing issues.
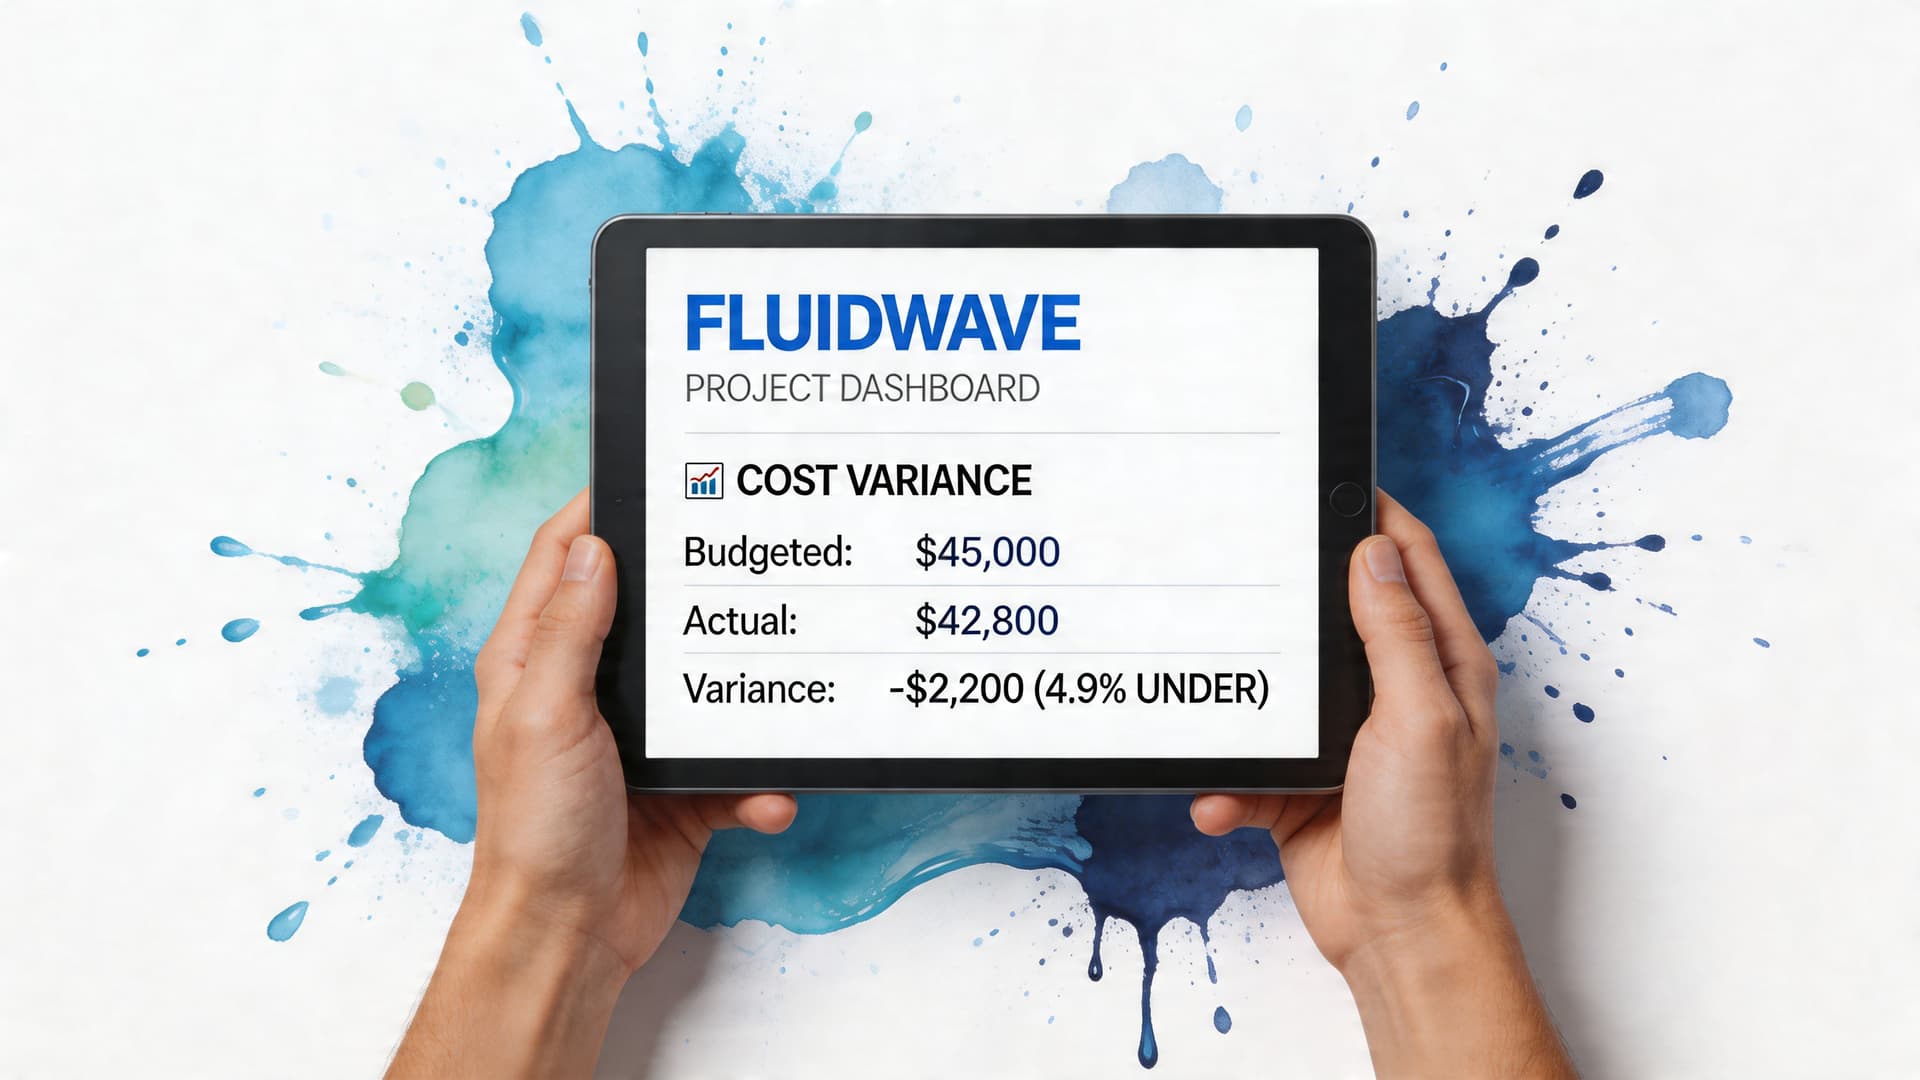
Putting Cost Variance to Work with Fluidwave
The most useful cost metrics are the ones your team will check during the week, not the ones buried in a month-end spreadsheet. That’s why cost variance becomes more powerful in short-cycle work such as sprints, client deliverables, delegated tasks, and operational workflows.
ProjectManager highlights this underserved angle in its discussion of sprint-level tracking. It notes that a 2025 PMI report found 68% of agile projects exceed budgets due to undetected period variances, and it points to task-level tracking with a ±5% threshold as a trigger for immediate delegation and correction, with a reported savings of 4+ hours per week in efficient workflows, as described in this piece on how to calculate cost variance.
A practical setup for dynamic teams
For fast-moving work, don’t wait until the end of the project to calculate CV. Track it at the task or sprint level.
A simple setup might include:
- Budget field: The approved cost for the task or sprint.
- Progress field: A realistic completion percentage.
- Earned value field: Budget multiplied by progress.
- Actual cost field: Hours, contractor charges, tool costs, or other spend.
- Variance status: A visual flag for favorable, neutral, or unfavorable performance.
This approach is especially helpful when work is delegated across multiple contributors. You can see which tasks are efficient, which ones need intervention, and which ones should be reassigned before the overrun grows.
What to do when a task goes negative
A negative variance should trigger a management response, not just a note in a report.
You might:
- Tighten scope if the task has expanded informally.
- Change the assignee if the current resource isn’t the right fit.
- Break the task down further if the estimate is too broad to manage.
- Delegate supporting work so the main contributor focuses on high-value output.
The best use of cost variance is not proving that a project went wrong. It’s catching the moment when you can still fix it.
Why this works for modern workflows
Traditional project controls were built for large programs. The same logic works for smaller, faster workflows if you scale it down. A founder can use it for launch prep. A freelancer can use it for client work. A team lead can use it to manage sprint economics without turning the process into a finance exercise.
That’s the practical value of the cost variance formula. It gives busy teams a way to make better decisions while the work is still moving.
Take Control of Your Project Finances Today
The cost variance formula is simple, but it changes how you lead. Instead of asking whether people are busy, you ask whether the value delivered matches the money spent. That’s a better question.
Use the formula consistently. Watch the trend, not just the latest number. Split cumulative results from period-by-period results when you need to find the source of a problem. Then act while your choices are still open.
If your work includes budgeting for physical projects, tools like construction estimating software can complement variance tracking by improving cost assumptions before execution starts.
Good budget control isn’t about obsessing over every dollar. It’s about seeing trouble early enough to respond with clarity.
Frequently Asked Questions About Cost Variance
What’s the difference between cost variance and schedule variance
Cost variance tells you whether the work completed has cost more or less than its earned value. Schedule variance asks a different question. It compares earned value to planned value to show whether the project is ahead or behind schedule.
A project can be late and still under budget. It can also be on schedule and over budget. That’s why experienced managers usually look at both.
What should I do first when cost variance is negative
Start with diagnosis, not blame.
Check whether the problem came from inaccurate progress reporting, missing cost entries, scope growth, expensive labor, or rework. Then decide whether to reduce scope, shift resources, renegotiate inputs, or break the work into smaller units for tighter control.
If the negative variance is getting worse over time, act quickly. Waiting usually reduces your options.
Can small teams use the cost variance formula
Yes. You don’t need enterprise software or a formal PMO to use it well.
A small team can calculate earned value from a task budget and completion percentage, compare that against actual spend, and review the result each week. In many ways, smaller teams benefit more because they can respond faster once they see the signal.
Is a positive cost variance always good
Not automatically.
A positive variance can mean efficient delivery, but it can also mean the team hasn’t fully completed the work, delayed necessary spending, or cut corners. Treat favorable variance as something to verify, not just celebrate.
How often should I calculate cost variance
Use a rhythm that matches the speed of the work.
For long, stable projects, monthly review may be enough. For agile sprints, delegated tasks, or fast client work, weekly or task-level review is often more useful because it catches drift before it hardens into a larger overrun.
If you want a cleaner way to track tasks, monitor progress, and delegate work without losing control of cost, Fluidwave gives you a practical workflow for turning project data into decisions. It’s a strong fit for busy professionals and teams who need visibility without adding more administrative drag.
Focus on What Matters.
Experience lightning-fast task management with AI-powered workflows. Our automation helps busy professionals save 4+ hours weekly.