80 20 Rule Business explained: what the Pareto principle shows, how to find the vital 20% in your data, and how to prioritize tasks wisely.
November 9, 2026 (1d ago)
80 20 Rule Business: Find the 20% That Drives Results
80 20 Rule Business explained: what the Pareto principle shows, how to find the vital 20% in your data, and how to prioritize tasks wisely.
← Back to blog
If you're spreading effort evenly across every customer, task, and problem, you're almost certainly overinvesting somewhere and underinvesting somewhere else. The useful move isn't to memorize a ratio. It's to test where results concentrate in your business, then sequence work around that evidence. Treat the split as a quarterly hypothesis, not a permanent law.
What the 80/20 Rule Means for Business
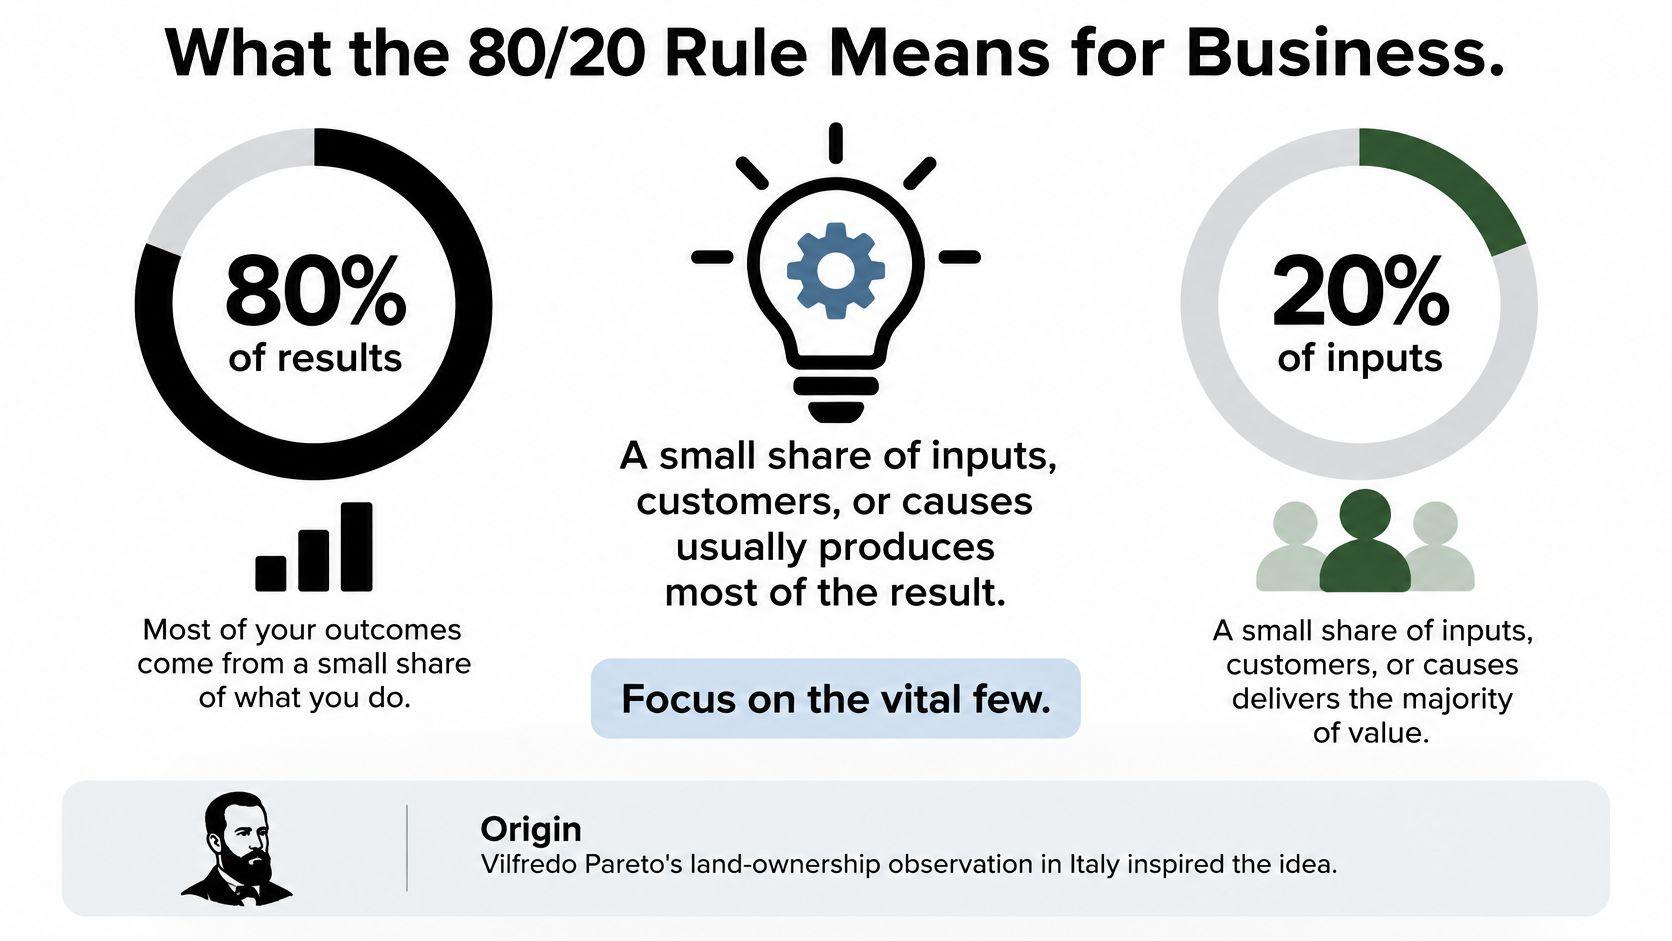
In the late 1890s, Italian economist Vilfredo Pareto reported that roughly 80% of the land in Italy belonged to about 20% of the population, a relationship described in his 1896-1897 economic research and his 1906 work, as summarized in the Pareto principle entry on Wikipedia. Management thinker Joseph Juran later turned that observation about unequal distribution into a working tool for business and quality control. The 80/20 rule in business is the same claim applied to your own numbers: a small share of inputs, customers, or causes tends to produce most of the result.
That "tends to" carries the whole argument. Published analyses of customer concentration show the top fifth of buyers accounting for anything from a slim majority of sales to a share well past the textbook ratio, depending on the industry and revenue model. Treat the split as a pattern worth verifying on your own books.
The Ratio Moves With the Business Model
Don't assume your split. It might be 70/30, 90/10, or much flatter. Subscription revenue tends to be less concentrated than one-off sales, because recurring payments smooth the differences between customers, so two companies with identical headcounts can land on very different answers.
Where the top 20% of customers usually lands by setting
| Setting | Typical position in the range |
|---|---|
| A single brand's heaviest buyers | Bottom of the range, often a slim majority of sales |
| Subscription businesses | Lower middle, recurring revenue flattens the curve |
| Public companies across sectors, on average | Middle of the range |
| Non-subscription businesses | Upper middle of the range |
| Consumer packaged goods categories | Upper end of the range |
| SaaS customers by revenue | Near the top, close to the classic split |
Read the table as a band, not a target. A SaaS firm, a consumer brand, and a subscription service shouldn't copy each other's cut, and none of them should assume last year's cut still holds. Customer mix shifts, pricing changes, a single large account can bend the curve in either direction.
My advice: treat 80/20 as the opening question of each quarter's review, then let your customer, product, and workload data identify the ratio before you move money or people around it.
How to Find the Vital 20% in Your Own Data
Start with records you already have. The visual below sets out the six steps before you change staffing, pricing, or priorities based on a hunch.
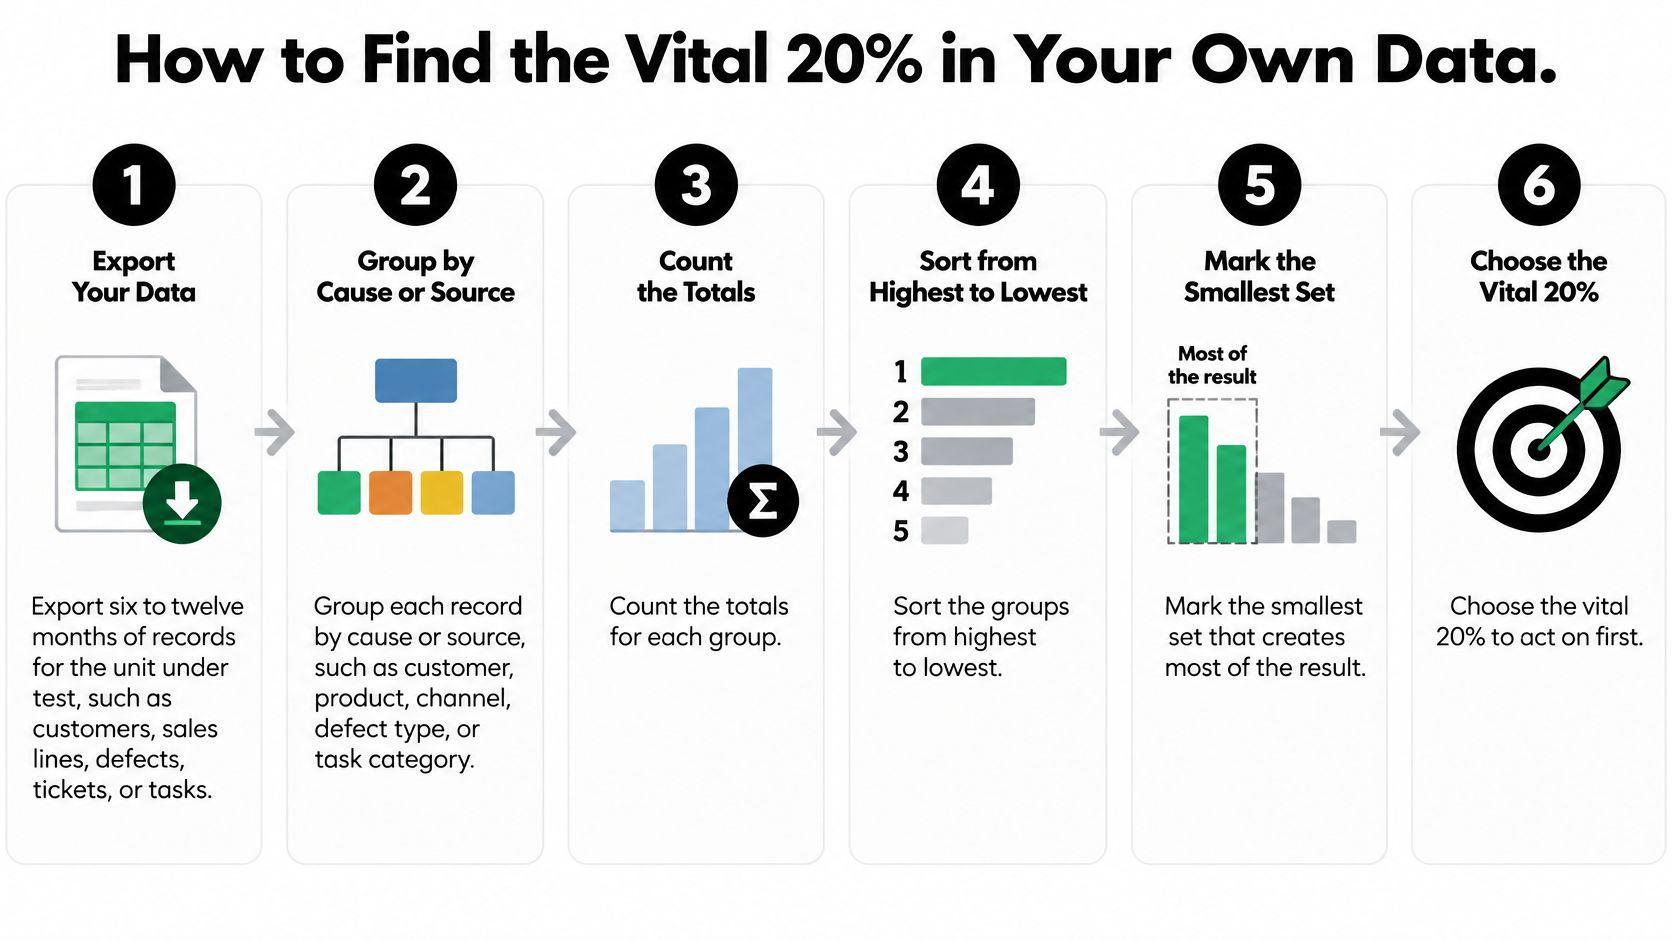
- Export six to twelve months of records. Pick one unit to test first, such as customers, sales lines, defects, support tickets, or tasks. A shorter window can overstate one unusual order or outage.
- Group each record by cause or source. Use product line, account, error type, channel, or root cause. Consistent labels matter more than fancy software.
- Measure each group in one meaningful unit. Choose revenue, gross margin, hours consumed, rework cost, or defect count. Don't mix units in the same ranking.
- Sort groups from largest to smallest and add a cumulative percentage. This shows how quickly the total builds as you move down the list.
- Mark the groups that reach about 80% of the total. Those groups are your provisional vital few, even if they aren't exactly one fifth of the categories.
- Check the cut against urgency and risk before acting. A rare safety, security, or compliance issue can jump the queue despite a small total.
That sequence follows standard Pareto analysis, which classifies incidents by cause, sorts causes by total impact, and computes the cumulative percentage until dominant contributors are visible, as described in a review of Pareto applications across business processes. The same review reported persistent asymmetry across production, logistics, marketing, and quality control, with roughly 20% of problem areas associated with about 80% of failures, costs, or results, although the exact ratio varies by context.
Sort by Cost, Not Just Frequency
Frequency alone can mislead you. A defect that occurs twice but triggers refunds, overtime, and expedited shipping may cost more than a minor error that occurs daily. If you rank only by count, expensive exceptions disappear. Normalize by cost or time whenever you can.
The same discipline helps outside operations. If you're testing which website pages or campaigns deserve attention, an Expressify AI traffic checker can help you compare traffic sources before you decide where content effort belongs. Pair that view with your critical success factors, so traffic volume doesn't outrank revenue, retention, or strategic fit.
This walkthrough shows the ranking logic in action.
Illustrative defect causes ranked by cumulative share
| Cause | Cumulative share |
|---|---|
| Missing specification | 34% |
| Late supplier parts | 59% |
| Operator setting error | 75% |
| Tool wear | 84% |
| Labelling errors | 90% |
| Six other causes combined | 100% |
Read the table from the top. Missing specifications alone account for the first 34%. Add late supplier parts and you're at 59%. Operator setting errors take the cumulative total to 75%, and tool wear pushes it to 84%. In this illustration, four causes get you past the usual cutoff, while six other causes share the final 10%.
A healthy result is short enough to act on this month. Usually, you'll see two to four dominant causes, a visible drop after them, and a long tail you can sequence later. If every category contributes almost equally, that's also useful. It means 80/20 prioritization won't create much benefit for that dataset.
Using the 80/20 Filter to Prioritize Your Tasks
Urgent and valuable aren't synonyms. A message marked urgent may protect nothing important, while a quiet task may unblock a customer launch, payroll, or a product release. I would score the open list before I trusted whoever shouted last.
Five criteria for an 80/20 task filter
| Criterion | Question to ask | High-value signal |
|---|---|---|
| Outcome impact | Does finishing this move revenue, cost or a key goal? | Directly tied to a stated goal |
| Dependency | Does anyone or anything wait on this? | Unblocks two or more other items |
| Deadline risk | What breaks if this slips by a week? | Customer, legal or payroll impact |
| Effort | How many hours will it take? | Under two hours with high impact (a quick win) |
| Reversibility | Can a mistake be undone cheaply? | Irreversible decisions get attention early |
Rank by Value per Hour
Use a measurable numerator. It might be revenue protected, gross margin gained, hours saved, a deadline protected, or defects avoided. Divide that outcome by the effort required, and you get value per hour, a much better ranking basis than task count. The Springer marketing research on Pareto ratios supports treating the rule as an empirical prioritization heuristic and ranking items by contribution per unit of effort, rather than assuming one fifth of tasks automatically produce four fifths of value.
Run the routine like this.
- Score every open task on outcome, dependency, deadline risk, effort, and reversibility.
- Rank by value per hour, then sanity-check the top items against deadlines and dependencies.
- Schedule the top fifth first, ideally in the morning when focus is highest.
- Batch the remaining tasks into fixed slots instead of deleting them. Small client requests and enabling work often sit there.
Sales work benefits from the same math. Before adding more outreach because the calendar looks empty, calculate outbound activity targets from the pipeline outcome you need, then protect time for the accounts and follow-ups with the strongest expected return. That's more disciplined than treating every prospect touch as equal.
Review the top group weekly. Quarter-end, staffing changes, a delayed supplier, or a new project can move a task from optional to critical in days. A practical planning and prioritizing routine keeps the filter current without turning every Monday into a full replanning exercise.
Working rule: Do the highest value per hour first, batch the rest, and delete only after you've checked dependencies.
The bottom of the list isn't automatically waste. It's work to sequence, delegate, automate, or consciously defer. That distinction keeps the filter useful instead of destructive.
Three Business Cases and What Each One Changes
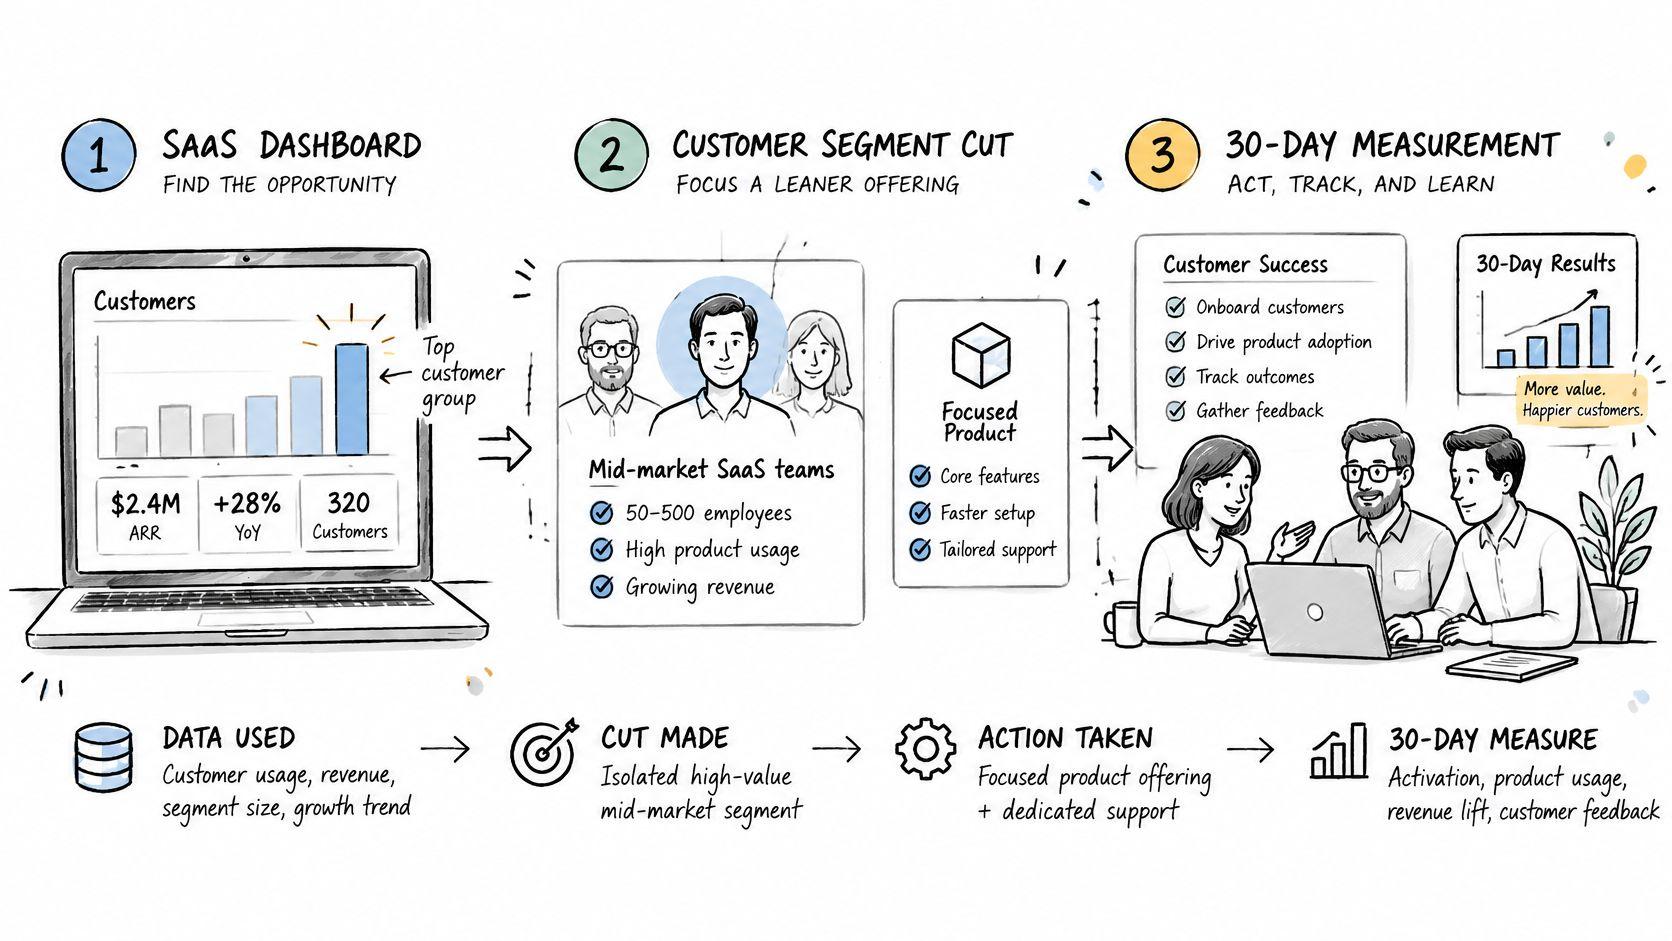
Say a SaaS company exports twelve months of subscription revenue by account and finds a familiar pattern. About 20% of customers produce about 80% of revenue. The action isn't to ignore everyone else. Give the top accounts named owners, earlier renewal conversations, and faster escalation paths. After thirty days, measure renewal risk, expansion conversations, and support response time for that group.
That SaaS split is a commonly cited estimate, so confirm it against your own billing export before setting account tiers. Your concentration may be lower, especially if pricing is uniform. The decision changes once you know whether churn among a handful of accounts could erase a month of new sales.
A Manufacturer Fixes Causes in Order
Now say a manufacturer groups six months of defect records by cause and ranks them by rework cost. A few causes drive most scrap, so the team fixes the top causes first and reviews the chart monthly. This follows the method Joseph Juran applied to industrial quality control in the 1940s, where about 80% of product defects may be caused by roughly 20% of production problems, according to Investopedia's explanation of the 80/20 rule.
After thirty days, don't just count total defects. Check whether the targeted causes fell, whether another cause moved up, and whether rework hours dropped. If the top cause stays flat, the countermeasure didn't address the root problem, no matter how busy the team looked.
A Support Team Shrinks the Queue
A support team can tag requests by type for one quarter and rank them by handling time. Password resets, invoice copies, address changes, and status checks might fill much of the queue. Standard replies, self-service pages, or automation for those recurring types can free specialists for complex cases.
Measure first-response time, resolution time, and reopened tickets after thirty days. Speed alone isn't success if canned answers create repeat contacts. Also remember that a brand's heaviest buyers often provide around half of sales, so concentrations can differ sharply between departments inside one company.
Each case starts with measurement, not a cut. The cut only tells you where to aim scarce attention first.
When the 80/20 Rule Misleads You
The most expensive mistake is cutting the bottom 80% outright. The split describes where outcomes were concentrated. It doesn't prove the remaining work has no value, and it doesn't prove shifting every resource to the top group will improve results.
Three conditions should make you pause.
- The measure is too narrow. Revenue alone misses retention, quality, risk reduction, dependencies, and long-term option value.
- The level of analysis changes the answer. Individuals, teams, and business units can produce different top groups from the same underlying work.
- Low frequency hides high risk. Compliance, security, reliability controls, and customer safety may contribute little volume until one failure becomes very expensive.
Evidence from Japanese data shows productivity distributions can follow Pareto-like patterns across workers, firms, and industries, while the Pareto index changes with the level of aggregation, as discussed in an arXiv analysis of Pareto productivity distributions. In plain terms, who looks like the high-value group depends on whether you analyze a person, a team, or a business unit.
A Small Account Can Carry Outsized Value
Say a small enterprise customer produces modest direct revenue but agrees to be your reference account. That reference helps win three larger customers. Ranked by current revenue alone, the account sits in the tail. Cut service to it and you may damage future sales that never appeared in the original spreadsheet.
Emerging projects create the same trap. Early work often shows low measurable output while it builds capability, tests demand, or removes a future bottleneck. Customer support and reliability work can also look unproductive until churn or downtime reveals what they were preventing.
Fix the method instead of abandoning it. Measure contribution with more than one measure, apply an urgency and risk check, and rerun the analysis each quarter. Compare intended priorities with completed outcomes, too. Tasks that repeatedly create downstream value deserve a higher score next cycle.
The rule shows where value was concentrated, not where it will be next quarter.
That sentence should sit above every Pareto chart you make. Concentration is descriptive first. It becomes prescriptive only after you've tested dependencies, risk, and timing.
Deciding What to Delegate, Automate or Keep
A high-value task list settles only half the question. The other half is ownership. Repetitive work is not automatically safe to hand off. Score each task by how easily you can verify the result and what an error would cost.
Who should own each type of task
| Task type | Verifiability | Cost of an error | Best owner |
|---|---|---|---|
| Scheduling, sorting and triage | High | Low | Automation rules with a human check |
| Drafting research and summaries | Medium | Medium | Virtual assistant, then your review |
| Recurring admin and data entry | High | Low | Automation or an assistant |
| Client commitments and pricing | Low | High | You |
| Strategy and priority decisions | Low | High | You, guided by your top-20% analysis |
In a field experiment spanning 66 firms and 7,137 knowledge workers, generative AI users spent about two fewer hours per week on email, yet researchers found no change in the quantity or composition of tasks overall, according to an NBER working paper on generative AI at work. Most roles can hand off only a modest share of the workload, because supervision and validation stay on your desk even after the transfer.
Saved hours do not turn into strategic work by themselves. Assign the recovered time to your top tasks before low-value demand refills the gap. That discipline matters most for the people Fluidwave is built for: solo founders, freelancers, executive assistants, small remote teams, and professionals with ADHD.
Use automation for sortable, reversible work. In Fluidwave, a rule can branch on conditions through Matches and Otherwise paths, then run actions such as Convert to Task, Set Priority, Add Label or Update Status. Rules that contradict or overlap get flagged before they corrupt the backlog. Inbox triage is the easy first case: move an email into a triage bucket, add a note, and the platform drafts a rule you can apply to the existing email backlog.
Give context-rich execution to a human assistant, and review the output until its error rate earns less checking. Keep pricing, client commitments, and consequential decisions with the accountable person. Recruitment applies the same logic: what Hirespot recommends automating in recruitment is the structured screening and scheduling around the hire, not the final judgement. The same boundary shapes a broader workflow and automation setup.
Before any handoff, ask three questions. Can I check the result in under five minutes? Is a mistake reversible? Does this need my judgement or client context? If the answers are yes, yes, and no, delegate it. If not, collaborate or keep it.
Confirm the Split and Act This Week
Turn the analysis into a weekly operating loop. A chart sitting in a spreadsheet won't change tomorrow's calendar.
- Pull one quarter of customer or task data and rerun the cumulative ranking. Keep the cut you can defend with current numbers.
- Load the vital items into your task tool as tagged tasks with due dates, owners, and dependencies filled in.
- Set a fixed thirty-minute weekly review to check whether the top group still matches deadlines, revenue, and staffing.
- Route routine items to automation rules or an assistant, then spot-check outputs until error rates stay low.
Fluidwave supports that loop without manual resorting. Auto-prioritization orders your list using tunable criteria such as due dates, quick wins, importance, and dependencies. The Active filter hides tasks you cannot act on right now and puts the most important task at the top. When a vital item is large, AI scheduling can split a four-hour task into three sessions across two days, with the remaining minutes shown.
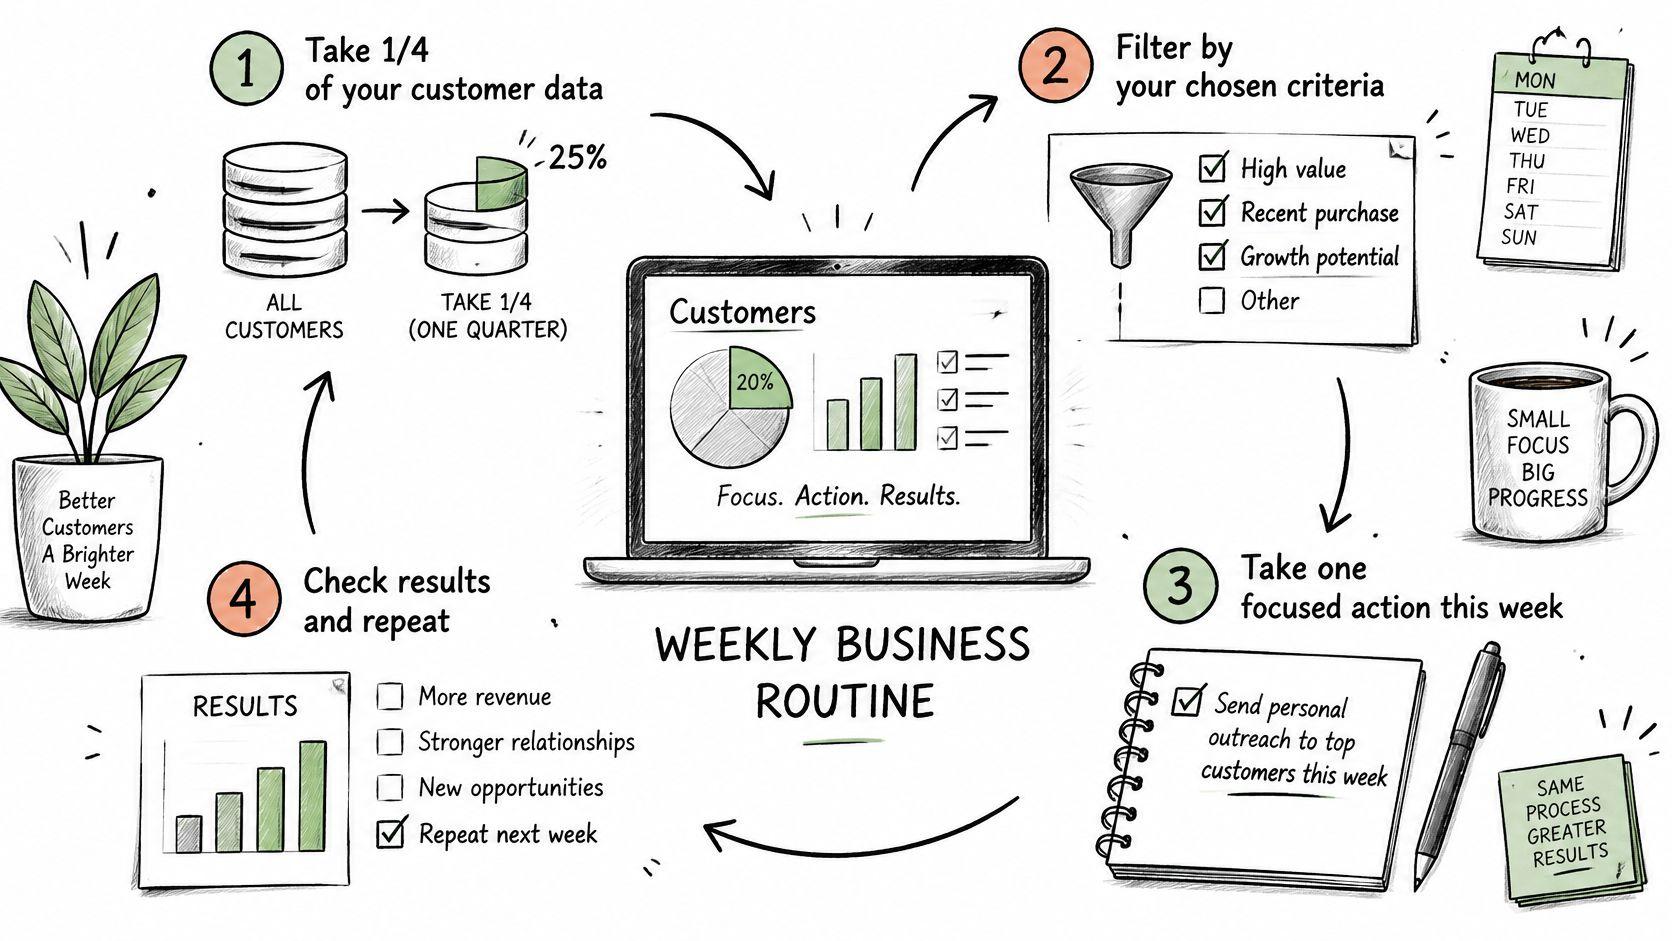
Set the weekly review as a recurring task so it appears on its own. During that review, promote newly critical work, demote stale priorities, and check whether delegated items still meet your verification standard. I'd keep the review short and make changes immediately, while the evidence is in front of you.
Tomorrow morning, enter your current top 20% as tasks and check that list before starting anything else. Then protect the first work block for the item with the strongest value per hour. That's the smallest useful test of the 80 20 rule business approach.
Put your measured vital few at the top of tomorrow's list, delegate the routine work that passes your verification check, and review the split every week. Visit Fluidwave to auto-prioritize tasks, schedule large work into realistic sessions, and keep your highest-value work visible.
Focus on What Matters.
Experience lightning-fast task management with AI-powered workflows. Our automation helps busy professionals save 4+ hours weekly.