Master business process analysis with our practical guide. Discover key methods, metrics, and a framework to optimize workflows and boost efficiency.
May 3, 2026 (1mo ago)
Business Process Analysis: Master Efficiency
Master business process analysis with our practical guide. Discover key methods, metrics, and a framework to optimize workflows and boost efficiency.
← Back to blog
You can feel when a business has outgrown its habits.
Tasks bounce between inboxes. People ask for updates in Slack because nobody trusts the project board. A client gets an answer, but only after three handoffs and two “just checking in” messages. Everyone’s busy. Nobody feels in control.
That’s usually the moment business process analysis stops sounding like corporate jargon and starts sounding useful.
Business process analysis is simple. You look closely at how work moves through your business, compare that reality to how it’s supposed to move, and fix what’s wasting time, creating errors, or draining attention. The point isn’t to produce pretty diagrams. The point is to stop losing hours to invisible friction.
For large companies, that might mean studying procurement, finance, or customer operations. For a founder, it might mean figuring out why onboarding feels messy. For a team lead, it might mean understanding why approvals stall. For an independent professional, it might mean finding out why simple admin work keeps wrecking deep-focus time.
The mistake people make is assuming process analysis belongs to specialists. It doesn’t. It belongs to anyone who keeps seeing the same operational pain show up in different clothes.
Introduction What Is Business Process Analysis Anyway
Business process analysis is the disciplined habit of examining how work gets done from start to finish. Not how the handbook says it works. Not how the manager thinks it works. How it works when real people, real tools, and real constraints are involved.
That distinction matters more than is often acknowledged. I’ve seen businesses with well-documented procedures still operate on workarounds, side conversations, and personal memory. On paper, the process looked clean. In practice, it was a patchwork.
What BPA really looks at
A proper analysis asks practical questions:
- Where does work start: What triggers the process in the first place?
- Who touches it: Which person, team, contractor, or system handles each step?
- Where does it slow down: Which handoffs, approvals, or dependencies create drag?
- What breaks repeatedly: Where do errors, rework, and missed details keep showing up?
- What adds value: Which steps help the outcome, and which steps only exist because of legacy habits?
Those questions sound basic. They’re also where most improvements come from.
Practical rule: If a team can’t describe a process in plain language, they probably can’t improve it yet.
Why this matters beyond operations teams
Business process analysis isn’t just for enterprise transformation projects. It’s useful anywhere work repeats and results matter.
A startup uses it to reduce chaos without hiring layers of management. A consulting firm uses it to make delivery more consistent. A busy executive uses it to stop simple tasks from consuming decision-making energy. A distributed team uses it to make handoffs visible instead of hoping people “stay aligned.”
What makes BPA valuable is that it turns frustration into something observable. Once you can see the flow, the delays, and the rework, you can redesign them. Until then, people usually blame effort, attitude, or capacity when process is the underlying issue.
When and Why Your Business Needs Process Analysis
Most companies don’t decide to analyze a process because they love operational discipline. They do it because something starts hurting.
Deadlines slip. Customers ask the same question twice. Team members redo work that should’ve been right the first time. Managers spend their day chasing status instead of making decisions. If growth makes everything feel more fragile instead of more efficient, that’s a process problem.

The warning signs are usually obvious
You probably need business process analysis if you’re seeing patterns like these:
- Frequent rework: People finish tasks, then reopen them because requirements weren’t clear or the handoff was incomplete.
- Approval delays: Work sits idle waiting for someone to review, sign off, or answer a basic question.
- Tool sprawl: One process lives across email, chat, spreadsheets, and a project board, so nobody has a reliable source of truth.
- Scaling pain: Adding clients or tasks creates disorder faster than it creates revenue.
- Morale issues: Good people get frustrated because they’re stuck doing cleanup work instead of meaningful work.
These problems don’t stay operational for long. They become financial, cultural, and customer-facing.
Complexity hides in successful businesses too
One reason BPA matters is that mature processes often collect extra steps over time. Someone adds a check. Another team adds a review. A special case becomes standard practice. Before long, a once-simple workflow becomes slow and bloated.
That’s exactly what showed up in TK Elevator’s credit and rebill process. Business process analysis found 232 distinct workflow paths, with 60% of instances concentrated in just two. The finding exposed unnecessary complexity that had accumulated over time, and it’s a strong example of why teams need to inspect real process behavior instead of trusting assumptions, as described in Splunk’s business process analytics example.
When one process has dozens or hundreds of variations, the issue usually isn’t flexibility. It’s drift.
That’s where the Pareto principle becomes useful. In process work, the big wins often come from a small number of causes. You don’t fix everything. You find the few issues doing most of the damage.
What BPA changes
Good analysis provides an advantage. It helps you remove low-value steps, tighten handoffs, reduce avoidable errors, and make throughput more predictable. It also gives managers a better alternative to hovering over people. Instead of asking “Why are we behind?” they can ask “Which step is causing the delay?”
That shift matters. It moves the conversation away from blame and toward design.
Common Business Process Analysis Methodologies
Most BPA methods are just different lenses for looking at the same problem. One helps you see waste. Another helps you define boundaries. Another helps you trace causes instead of reacting to symptoms.
You don’t need to use every method on every process. You need to pick the one that matches the problem in front of you.
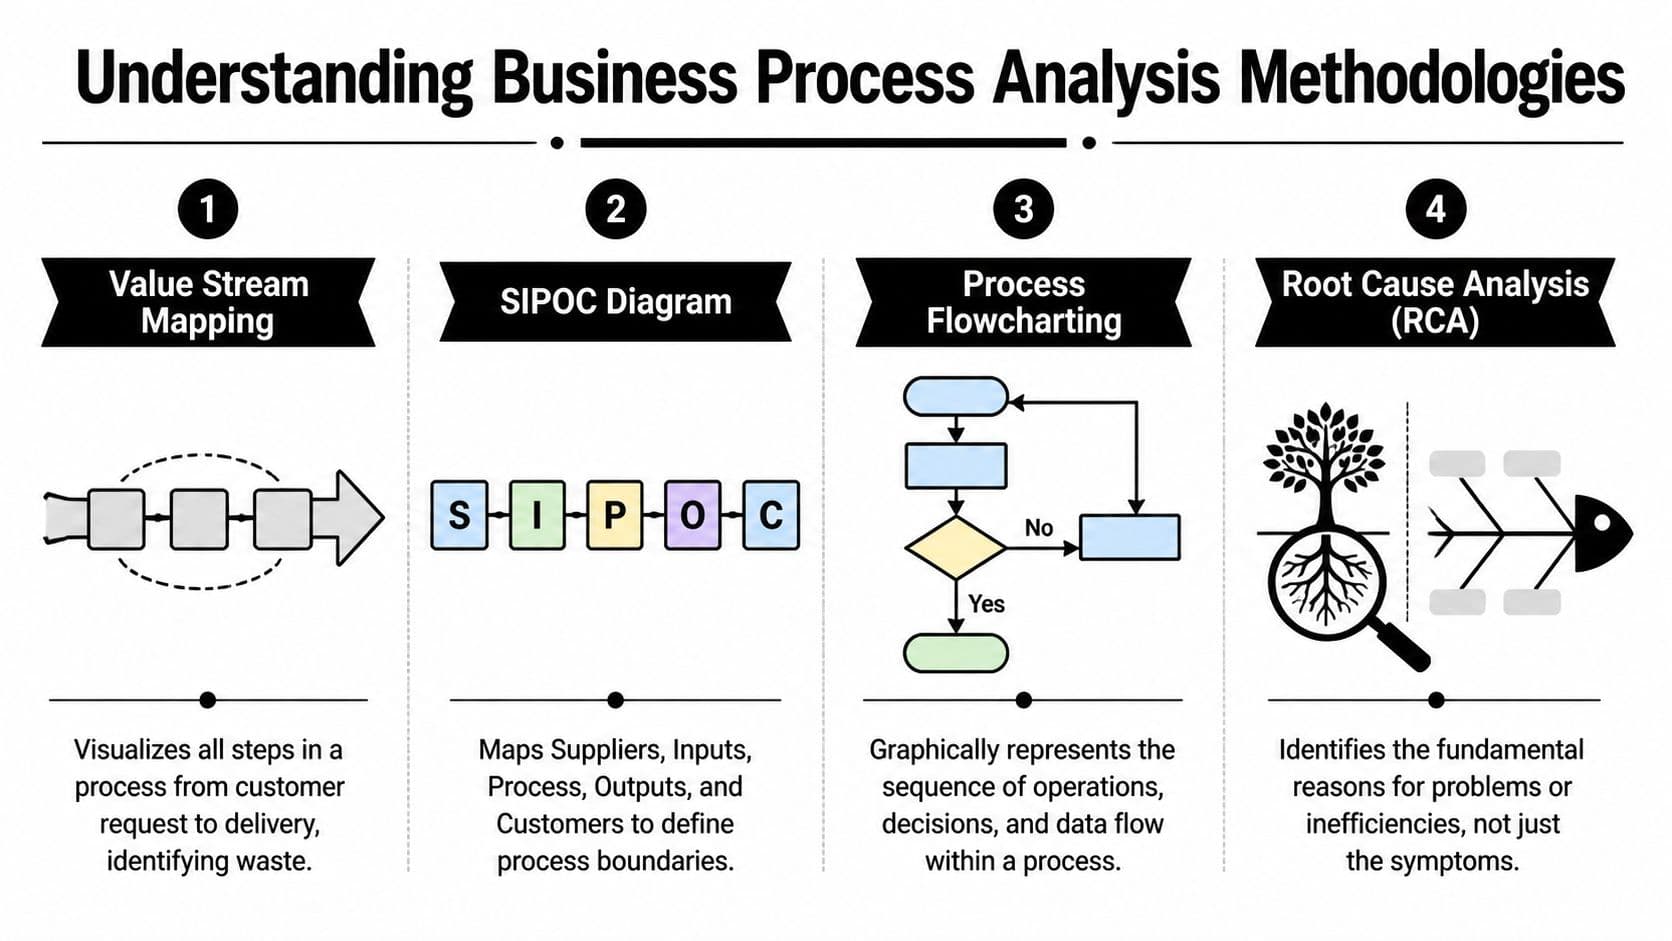
Four methods worth knowing
Value Stream Mapping is the method I reach for when a process feels slow and nobody agrees why. It maps the full flow of work from request to delivery. Think of it as a GPS route for the process. You can see where the work moves, where it waits, and where nobody is adding value.
SIPOC stands for suppliers, inputs, process, outputs, and customers. It’s useful when a process is fuzzy at the edges. If people keep debating where work starts, what counts as an input, or who the customer really is, SIPOC clears the fog.
Process flowcharting is the most familiar method and still one of the most useful. It lays out the sequence of actions and decision points. For teams new to process analysis, a flowchart is often the fastest way to make hidden complexity visible. If you want a practical primer on this approach, Fluidwave’s guide to flowcharts and process mapping is a useful starting point.
Root Cause Analysis, especially the 5 Whys, is what you use when the visible problem isn’t the actual problem. Late deliverables might not be about slow workers. They might come from unclear intake, duplicated approvals, or bad task routing.
Choosing your BPA method
| Methodology | Core Purpose | Best For Finding... |
|---|---|---|
| Value Stream Mapping | Visualize the full flow and spot waste | Waiting time, bottlenecks, redundant steps |
| SIPOC | Define the process boundary and key actors | Missing inputs, unclear ownership, scope confusion |
| Process Flowcharting | Map sequence and decisions clearly | Loops, approval clutter, branching complexity |
| Root Cause Analysis | Trace symptoms back to underlying causes | Rework, delays, recurring failures |
| Gap Analysis | Compare current state to desired state | Missing capabilities, broken handoffs, design flaws |
What works and what doesn’t
Root Cause Analysis is especially useful when teams keep treating symptoms as separate incidents. One missed deadline becomes a reminder. Then another reminder. Then a dashboard. None of that fixes the actual cause.
According to Moxo’s overview of business process analysis, Root Cause Analysis, using techniques like the 5 Whys, is critical for tracing process deviations. When combined with gap analysis, it can resolve up to 70% of process waste in cross-functional teams and lead to cycle time reductions of 25-35%.
A process doesn’t improve because you documented it. It improves because you found the constraint and changed the design around it.
What doesn’t work is using methodology as theater. Teams build elaborate maps, hold workshops, and produce decks, but never change ownership, rules, or tooling. In that case, the method isn’t the problem. The follow-through is.
Your Step by Step Guide to Performing an Analysis
Most process analysis efforts fail because the scope is sloppy from the start. Someone says, “Let’s fix onboarding,” when they really mean lead handoff, kickoff scheduling, document collection, client approvals, and internal resourcing all at once. That’s too broad.
Start narrower. Pick one process with a clear trigger and a clear finish line.

Start with the problem, not the map
Before drawing anything, define what’s wrong in practical terms. “The team is overwhelmed” is not specific enough. “Client proposals take too long to assemble” is better. “Task requests disappear between email and the project board” is better.
Write down three things:
- The process you’re analyzing
- The outcome you want
- What failure currently looks like
That forces discipline. It also keeps the work tied to a business need instead of drifting into documentation for its own sake.
Gather reality from the people doing the work
The next move is simple and often skipped. Talk to the people inside the process.
Ask them where they wait, what they redo, what they have to chase, and what they wish someone had fixed six months ago. Don’t only interview managers. The person doing intake, scheduling, data entry, or coordination usually sees failure points long before leadership does.
Useful evidence includes:
- Actual task histories: Not ideal workflows, but what happened
- Message trails: Where handoffs and confusion show up
- Existing docs: SOPs, checklists, templates, approval rules
- Observed exceptions: The “special cases” that happen all the time
If your team needs help structuring that work, Fluidwave’s article on streamlining business processes is a practical companion.
Map the current state as it really is
Now build the as-is process. This can be a whiteboard, a shared doc, a flowchart, or a Kanban sequence. The format matters less than the honesty.
You’re trying to capture:
-
Entry point
What starts the process? -
Major actions
What steps happen in order? -
Decision points
Where does someone approve, reject, clarify, or reroute? -
Handoffs
Where does responsibility move from one person or tool to another? -
End state
What counts as done?
The fastest way to ruin this stage is to tidy the map too early. Leave the ugly parts in. If work loops backward, show that. If two people do the same review, show that too.
A short walkthrough can help teams visualize the exercise before they try it themselves.
Analyze, redesign, and test
Once the current state is visible, patterns usually jump out. Work waits in the same place. Requests arrive incomplete. Tasks sit with the wrong owner. A “quick check” creates a queue.
At that point, redesign the to-be process with restraint. Don’t add policy to compensate for weak design. Remove unnecessary branching, tighten inputs, make ownership explicit, and reduce the number of times a task changes hands.
Field note: The best process redesigns usually feel boring. Fewer decisions. Fewer exceptions. Fewer places for work to hide.
Then test the revised flow on a small set of tasks before rolling it out broadly. That’s where teams learn whether the process is better or just cleaner on paper.
Key Performance Metrics That Actually Matter
A process can feel cleaner after a redesign and still perform badly. I see this all the time. A team removes a few annoying steps, everyone agrees the new flow looks better, then work still stalls because nobody measured the delays, rework, or misses that mattered.
Track a small set of metrics tied to the job the process is supposed to do.
Measure the process from four angles
Good measurement answers four practical questions. How long does work take? How often does it go wrong? Where does it wait? How predictable is the result?
That gives smaller teams enough signal to improve without building a reporting project they will abandon in two weeks.
| Metric angle | What it tells you | Simple examples |
|---|---|---|
| Speed | How long work takes to move from intake to done | Cycle time, touch time, queue time |
| Quality | How often output needs fixing or causes downstream problems | Error rate, rework rate, missed requirements |
| Flow | Where work gets stuck between people or tools | Handoff delay, blocked time, backlog age |
| Predictability | Whether the process finishes consistently | On-time completion rate, variance by owner, exception rate |
Start with a working scoreboard
For many teams, five measures are enough:
- Cycle time: Total elapsed time from request to completion
- Touch time: Time spent actively working, not waiting
- Rework rate: How often someone has to correct or redo the work
- Handoff delay: How long work sits between one owner and the next
- On-time completion rate: Whether the process hits the promised finish point
If you want a sharper way to define and calculate these, use this guide on how to measure operational efficiency. It is a practical reference, especially for solo operators and distributed teams that need clear numbers without an operations department.
Customer-facing processes need one more layer. Speed matters, but speed without quality just creates faster disappointment. If your workflow touches support, onboarding, or account management, external benchmarks for B2B SaaS customer care metrics can help you balance response time with actual service quality.
Avoid vanity metrics
Activity counts are tempting because they are easy to pull. Tickets closed. Messages sent. Tasks completed.
Those numbers can hide a bad process. Closing 40 tickets means very little if half were reopened. Finishing a batch quickly is not a win if the next person has to fix it. Measure output quality and flow reliability, not just volume.
Baselines beat ambition
“Get more efficient” is not a usable target. “Cut invoice approval time from five days to two, while keeping error rates flat” is usable.
Baseline first. Change second. Compare third.
Fluidwave helps here because it makes the work visible in one place. You can see where requests enter, who owns the next action, how long tasks sit untouched, and which steps keep bouncing back for clarification. That turns process analysis from a consulting exercise into something a small team can run every week without a spreadsheet maze.
Ask a hard question at the end: did the process save time, reduce mistakes, or lower the mental load on the people doing the work? If the answer is unclear, the metric set is too weak or the redesign did not solve the problem.
From Analysis to Action with Fluidwave
Process analysis only earns its keep when the redesigned workflow changes daily behavior. That’s where many teams get stuck. They identify broken handoffs and manual busywork, then keep running the same system with better awareness.
The harder part is operationalizing the new design.

The redesign has to live somewhere
A better process usually needs a few concrete supports:
- Clear intake: Work enters with enough context to move forward
- Visible ownership: Somebody is accountable at each stage
- Shared status: The team can see what’s waiting, blocked, or done
- Structured delegation: Low-value work can move without confusion
- Consistent prioritization: Important tasks don’t compete blindly with noise
A tool can either help or make things worse. If the software hides status, fragments communication, or forces work back into personal inboxes, you haven’t improved the process. You’ve just digitized the mess.
Distributed teams need different process design
Traditional BPA guidance often assumes people work in the same place or at least on the same rhythm. That’s not how many teams operate now. Contractors, virtual assistants, founders, full-time staff, and AI-assisted workflows all touch the same output, often asynchronously.
That matters because distributed work introduces a different kind of failure. Work doesn’t just stop at bottlenecks. It disappears between channels, time zones, and ownership boundaries. Bizzdesign’s discussion of business process analysis highlights this gap directly, noting that asynchronous work across time zones creates unique handoff delays and communication bottlenecks, making tools with real-time visibility across distributed execution essential.
Turning findings into execution
Fluidwave fits as one operational option. If your analysis shows that work gets stuck during manual assignment, the fix isn’t another reminder message. It’s a workflow that routes and prioritizes tasks clearly. If the problem is overloaded knowledge workers doing low-value admin, delegation has to be built into the process rather than treated as an exception. If visibility is the issue, the team needs a shared view that shows progress and waiting points without requiring a status meeting.
A practical rollout often looks like this:
| BPA finding | Operational fix |
|---|---|
| Intake requests arrive incomplete | Standardize the request format before work starts |
| Work stalls between owners | Use a shared task view with explicit handoff states |
| Senior staff spend time on repeatable admin | Delegate discrete tasks to assistants with clear budgets and deadlines |
| Priorities change constantly | Use a rule-based prioritization flow instead of ad hoc reshuffling |
| Distributed teammates miss updates | Keep work status in one visible system instead of scattered messages |
That’s the true bridge between analysis and improvement. Not another workshop. A live workflow that reflects the redesigned process.
Process improvement becomes real when people no longer have to remember the system because the system carries more of the load.
Making Process Improvement a Habit
The strongest process work is rarely dramatic. It’s cumulative.
A team notices one recurring friction point, maps it, tightens it, and learns from the result. Then they do it again somewhere else. Over time, that creates a business that feels calmer, faster, and easier to run. Not because people started working harder, but because the work stopped fighting them.
That’s why business process analysis is worth learning even if you never run a formal transformation program. It gives you a repeatable way to spot waste, reduce rework, and make better use of people’s attention. For professionals in service businesses, it also pairs well with broader reading on automation for professional services, especially when you’re deciding what should stay human and what should become standardized.
Start small. Pick one process that annoys people every week. Map the current state accurately. Measure a few signals that matter. Make one useful change. Then watch what happens.
That’s usually enough to prove the point.
If your workflows keep breaking at the same handoffs, Fluidwave gives you a practical way to put process analysis into action with structured task management, automation, delegation, and shared visibility across distributed work. Start with one messy process, rebuild it in a clearer flow, and let the system carry more of the coordination burden.
Focus on What Matters.
Experience lightning-fast task management with AI-powered workflows. Our automation helps busy professionals save 4+ hours weekly.