Measuring productivity isn’t about clocking hours — it’s about the value your team delivers. Define success for each role, pick metrics that reflect real outcomes, and monitor progress against clear benchmarks. This approach shifts the focus from busywork to business impact.
December 20, 2025 (5mo ago) — last updated February 21, 2026 (3mo ago)
Measure Employee Productivity Without Micromanaging
Learn to measure employee productivity with a modern outcomes-based framework that prioritizes results over hours, boosting performance, engagement, and sustainable growth.
← Back to blog
Measure Employee Productivity Without Micromanaging
Learn how to assess productivity with a modern outcomes-based framework that prioritizes results over hours, boosting performance, engagement, and sustainable growth.
Introduction
Measuring productivity isn’t about clocking hours — it’s about the value your team delivers. Define success for each role, pick metrics that reflect real outcomes, and monitor progress against clear benchmarks. This approach shifts the focus from busywork to business impact.
Why Old Productivity Measures No Longer Work
Let’s be honest: the old model — presence equals performance — worked on a factory floor but fails for today’s knowledge work. The gap between being busy and being productive is a common blind spot. We’ve all seen the coworker who’s online constantly, firing off emails at all hours, yet their contribution to the team’s goals is unclear. That’s the trap of mistaking activity for achievement.
The Problem with Counting Hours
The rise of remote and hybrid work shattered the illusion that clocked hours matter. When your team isn’t in the same space, you must judge work by what it delivers, not how long people appear to be working. This is a shift from presence to performance that has been long overdue.
Studies consistently find that the average office worker is truly productive for only about 2 hours 53 minutes to 4 hours 12 minutes per day1. The spread depends on measurement method—passive computer tracking versus self-reporting—but the bottom line remains: paying for a full day of time does not guarantee a full day of output.
“सबसे बड़ी गलती पारंपरिक उत्पादकता माप में इनपुट (बिताया गया समय) को आउटपुट (निर्मित मूल्य) से भ्रमित करना है। एक इंजीनियर जो एक जटिल बग को एक एकाग्रित घंटे में हल कर देता है, वह उस इंजीनियर से कहीं अधिक उत्पादक है जो उस पर एक सप्ताह बिताता है और कुछ नहीं निकलता。”
Shifting Focus to What Really Matters
This isn’t just a remote-work issue — it’s about the nature of modern work. For roles like software development, marketing, or design, value isn’t created linearly. One brilliant burst of creativity can deliver more value than 40 hours of distracted work. To measure productivity today, you first have to understand what creates value for each role.
Acknowledging that “time-on-task” is flawed is the first step. Then build a system that measures what actually moves the needle for your business. That creates a fairer, more accurate view of contributions and a culture that values real achievement.
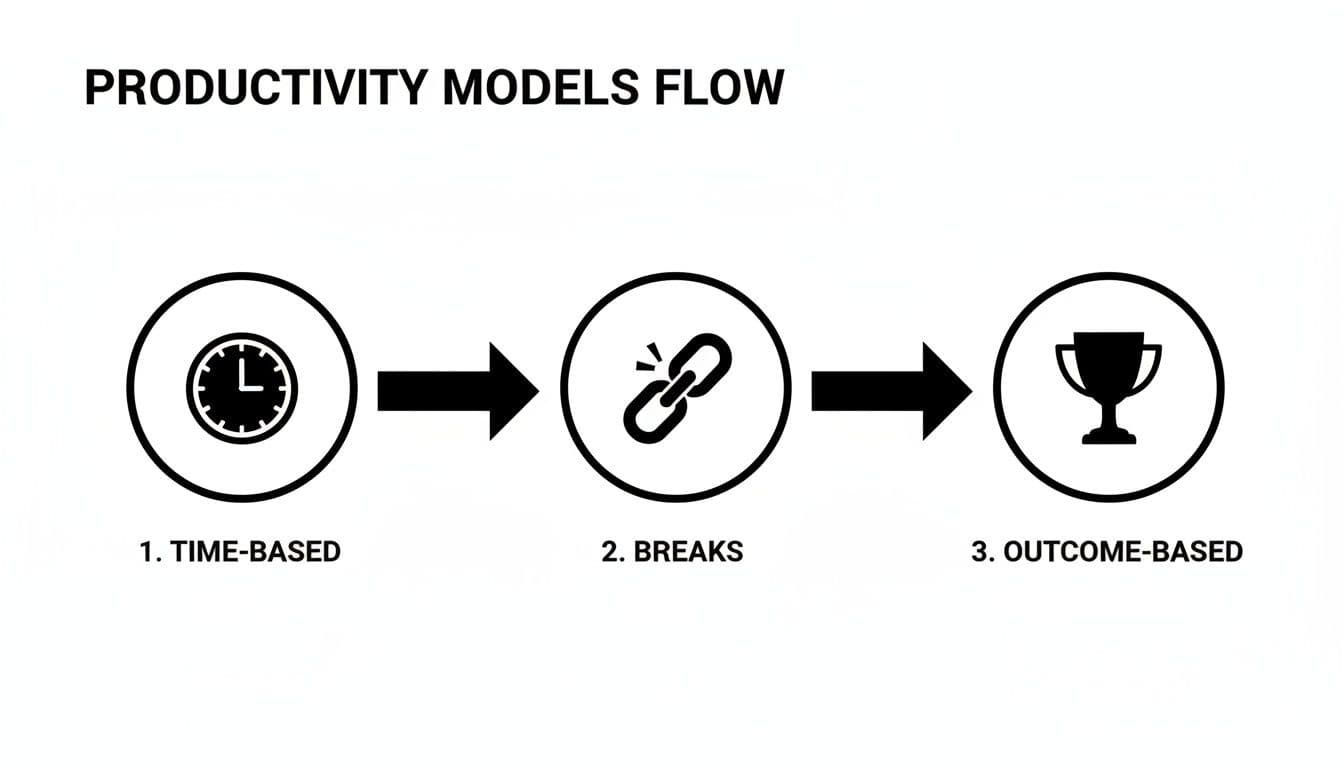
Time-Based vs. Outcome-Based Productivity Metrics
To make this shift real, see the two approaches side by side. Traditional metrics ask “how long,” while modern metrics ask “how well.”
| Metric Type | Example | What It Measures | Potential Pitfall |
|---|---|---|---|
| Time-Based | Hours worked per week | Presence and availability | Rewards inefficient work; doesn’t correlate with value. |
| Time-Based | Time to first response (support) | Speed of initial engagement | Can incentivize quick, low-quality replies. |
| Outcome-Based | Customer satisfaction score (CSAT) | Quality and effectiveness of a solution | Can be influenced by factors outside the employee’s control. |
| Outcome-Based | Features shipped per quarter (dev) | Tangible delivery of value to users | Can encourage rushing and technical debt without quality checks. |
| Outcome-Based | Sales revenue generated | Direct contribution to business goals | May ignore collaborative or enabling roles. |
Choosing the right metric isn’t about ditching one approach entirely. It’s about a balanced view. While an outcome metric like CSAT is the ultimate goal, a time-based metric like average resolution time can still offer useful signals. The key is ensuring main success measures tie to real results, not just the clock.
Building a Modern Productivity Measurement Framework
Moving past old-school tracking requires a thoughtful plan. Building a modern framework isn’t about tossing a few metrics onto a dashboard. It starts with clarity on what success looks like for each role and finding data that tells that story.
Define Productivity for Each Role
Before you measure anything, define the outcome you want. This means sitting down with team leads—and the employees themselves—to map out what a productive day, week, or quarter looks like. That conversation is the bedrock of your system.
Without clarity, you’ll measure activity, not achievement. For example, tracking the number of emails a marketing manager sends is a vanity metric; it tells you nothing about impact. A better measure is the number of qualified leads generated or the conversion rate of a landing page they built.
“लक्ष्य यह है कि बातचीत को ‘आपने क्या किया?’ से बदलकर ‘आपके काम का क्या प्रभाव पड़ा?’ में बदल दिया जाए।”
Select a Balanced Mix of Metrics
Once you’ve defined productivity for each role, pick metrics that paint a full picture. A balanced scorecard approach across three metric types:
- Output Metrics: Direct quantity measures—articles written, tickets closed, features delivered.
- Outcome Metrics: Quality and impact—CSAT, revenue growth, churn reduction.
- Efficiency Metrics: Resources used—cost per acquisition, time to resolution, revenue per employee.
For broader insights, connect these measures to HR analytics to reveal organizational trends and signal where to invest in training or process change.
Establish Baselines and Set Realistic Goals
You can’t know if you’re improving without a baseline. Let teams run for a few weeks to establish starting points for each metric.
Initial data gives you a realistic launchpad. For example, if your support team’s average first response time is 45 minutes, set an achievable goal—like 35 minutes—rather than an arbitrary target.
Look at macro benchmarks too. The OECD reported average labor productivity across member countries near USD 70 per hour in 2023, which can serve as a high-level anchor when translating broad goals into role-level targets2.
This data-first approach keeps your system fair, informed, and aligned with business needs.
Choosing the Right Metrics for Different Teams
The biggest mistake is applying the same yardstick to every person. A one-size-fits-all approach produces skewed data and frustrated employees. Tailor measures to each department’s contribution.
| Department | Quantitative Metric | Qualitative Metric | Efficiency Metric |
|---|---|---|---|
| Sales | Revenue per rep | Customer lifetime value (CLV) | Sales cycle length |
| Customer Support | First-contact resolution (FCR) | Customer satisfaction (CSAT) | Average resolution time |
| Engineering | Deployment frequency | Change failure rate | Cycle time |
| Marketing | MQLs generated | Brand sentiment | Cost per lead (CPL) |
| HR | Time to fill | Employee Net Promoter Score (eNPS) | Cost per hire |
Metrics for Sales Teams
Sales productivity often ties directly to the bottom line. Track a mix of KPIs:
- Revenue per sales rep
- Sales cycle length
- Lead conversion rate
- Customer lifetime value (CLV)
Metrics for Customer Support Teams
Balance speed with quality. Track both quantitative and qualitative measures:
- First response time (FRT)
- Average resolution time
- Customer satisfaction score (CSAT)
- First-contact resolution (FCR)
Metrics for Engineering and Development Teams
Delivery, quality, and reliability are key. Avoid lines-of-code metrics. Focus on:
- Cycle time: start to production
- Deployment frequency
- Change failure rate
- Mean time to recovery (MTTR)
These are the DORA metrics, which help measure team performance based on outcomes and system health rather than busyness4.
The Human Side of Measuring Productivity
Dashboards and data tell only part of the story. If you focus only on numbers, you risk creating a surveillance culture where people feel like cogs. The best frameworks put people first.
Empowering Your Team with Data
How you share productivity data matters. Public leaderboards often breed resentment. A smarter approach is personalized, private dashboards where individuals can track their progress against goals.
When people see their own data, they can spot patterns, make adjustments, and take ownership. Transparency should empower, not punish.
“जब कर्मचारी डेटा को विकास का एक उपकरण मानते हैं ना कि सज़ा देने वाली छूरी, तो वे उत्पादकता बढ़ाने में सक्रिय साझेदार बन जाते हैं。”
The Link Between Engagement and Output
You can’t separate productivity from engagement. Disengaged employees can follow processes yet deliver minimal value. Engaged employees look for smarter ways to reach goals. Disengagement has a real economic cost. About 21% of employees globally are actively engaged at work, and engaged teams can show roughly 14% higher productivity3.
Adding an engagement metric, like eNPS, helps uncover the “why” behind your numbers.
Navigating the Ethical Considerations
- Be open about the why: the goal is to improve processes and support people, not to catch them out.
- Involve your team: get input on chosen metrics to ensure fairness and relevance.
- Focus on trends, not moments: review performance over weeks or months to avoid knee‑jerk reactions.
Trust is non‑negotiable for any productivity initiative to work.
Weaving Your Tools Together for Effortless Tracking
You’ve designed your framework and picked your metrics. Now collect the data without creating manual work. A measurement system that adds overhead will fail.
Integrate the tools your team already uses—project management, CRM, communication apps—into a central dashboard. Automate data flows so measurement runs quietly in the background and respects people’s time.
Finding the Right Tech Stack
Choose software that integrates easily, respects privacy, and fits your framework.
- Plays well with others: strong APIs or native integrations with Asana, Jira, Salesforce, Slack, and your CRM.
- Keeps things private and transparent: prioritize business outputs, not invasive surveillance.
- Fits your framework: customizable dashboards for role-specific KPIs.
This connected view lets managers see project health at a glance without interrupting the team.

Putting Data Collection on Autopilot
Automation is where the real value appears. Integrate your VoIP with your CRM to avoid manual call logging. Pull deployment data from your pipeline rather than asking developers to self-report.
Blending data from different sources gives you richer insights—for example, linking CRM and support platforms to see the full customer journey. Modern platforms with AI can spot bottlenecks and suggest improvements, freeing managers to coach and remove blockers.
“एक टेक-समर्थित उत्पादकता प्रणाली का अंतिम लक्ष्य मापने को अदृश्य बनाना है। यह बिना काम में व्यवधान डाले पृष्ठभूमि में शांति से चलनी चाहिए, और अंतर्दृष्टि प्रदान करनी चाहिए。”
Connecting the Dots in Daily Workflow
Introduce tools that fit existing habits to reduce friction. For example, a task manager that integrates with Slack lets team members update statuses without leaving the app they use daily.
A marketing workflow might look like this:
- A campaign is built in a project tool with tasks and owners.
- The team shares assets and progress in their messaging app.
- The project tool tracks task completion and cycle times automatically.
- The marketing platform feeds lead and conversion data into a central dashboard.
- The manager sees both project progress and campaign results on one screen.
A connected ecosystem delivers low‑effort insights to guide the team. Fluidwave can help automate this flow so you focus on coaching, not chasing data.
Common Questions About Measuring Productivity
Getting ahead of common concerns shows you’ve considered the human element.
How do you measure productivity for creative or knowledge-based roles?
Shift from counting completed tasks to measuring impact. For designers, track conversion lift from a new page or feedback from user testing. For developers, use cycle time and change failure rate to measure delivery and quality. For strategists, measure adoption rate of a new process or on‑time project launches. The trick is linking work to tangible business outcomes.
Won’t employees feel like they’re being spied on?
Transparency and purpose matter. Position measurement as insight, not oversight. Be upfront about what you measure and why, and involve teams in choosing metrics. When people see data as a tool to help them win, fear fades.
What if an employee’s numbers are low?
Treat dips as signals, not judgments. Use data to start a supportive conversation: are they struggling with tools, overloaded, or burned out? This approach turns a negative moment into an opportunity for coaching and support.
Ready to move from theory to action? Explore Fluidwave’s tools to track progress, delegate tasks seamlessly, and give your team the clarity they need to perform at their best. Start managing your team’s productivity the smart way.
Quick Q&A — Practical Takeaways
Q: How should I start measuring productivity without micromanaging?
A: Begin by defining outcomes per role and selecting 2–3 balanced metrics that reflect real value.
Q: How do I avoid turning data into surveillance?
A: Be transparent about purpose, involve teams in choosing metrics, and use data for coaching—not punishment.
Q: Which metrics should I automate first?
A: Automate integrations that remove manual reporting—CRM, deployment pipelines, and project tools feeding a central dashboard.
1.
RescueTime: “The State of Focus” and related productivity reports; see RescueTime for research on average focused work time.
2.
OECD: labour productivity statistics and analysis (2023); see OECD for national and industry comparisons.
3.
Gallup: State of the Global Workplace and employee engagement research; see Gallup for engagement and productivity correlations.
4.
DORA metrics overview and research on software delivery performance; see Google Cloud’s DevOps resources at https://cloud.google.com/devops.
जो अहम है उस पर ध्यान केंद्रित करें।
AI-संचालित वर्कफ़्लो के साथ तेज़-तर्रार कार्य प्रबंधन का अनुभव करें। हमारी ऑटोमेशन व्यस्त पेशेवरों को हर सप्ताह 4+ घंटे बचाने में मदद करती है।